Κατέβασμα παρουσίασης
Η παρουσίαση φορτώνεται. Παρακαλείστε να περιμένετε

1
ΑΓΓΕΙΑΚΕΣ ΕΠΑΣΒΕΣΤΩΣΕΙΣ
ΝΙΚΟΛΑΟΣ ΣΤ. ΑΣΚΕΠΙΔΗΣ Επιμελητής νεφρολογικής κλινικής Γ. Νοσ. «ΠΑΝΑΓΙΑ» Θεσσαλονίκης

2
Κατανομή ασβεστιου(Cα)
Οστά 99% του συνολικού Ca (990 g) Ενδοκυττάριο Ca 0,9% του συνολικού Ca Διάμεσο Ca 0,075% του συνολικού Ca (0,75 g) Ca πλάσματος 0,025% του συνολικού Ca (0,25 g) Ολικό ασβέστιο σώματος = 1000 g
 Ενδοκυττάριο Ca. 0,9% του συνολικού Ca. Διάμεσο Ca. 0,075% του συνολικού Ca. (0,75 g) Ca πλάσματος. 0,025% του συνολικού Ca. (0,25 g) Ολικό ασβέστιο σώματος = 1000 g.")
3
Συστηματική διαταραχή του μεταβολισμού των οστών και των αλάτων λόγω ΧΝΑ
Βιοχημικές διαταραχές Ca, P, ΑLP, PTH, βιταμίνης D Διαταραχές οστικού μεταβολισμού Οστική εναλλαγή, επιμετάλλωση του οστού, όγκο, γραμμική ανάπτυξη, δύναμη Αγγειακές επασβεστώσεις

4
Δευτεροπαθής Υπερπαραθυρεοειδισμός Βιοχημικές διαταραχές
Επασβεστώσεις Δευτεροπαθής Υπερπαραθυρεοειδισμός Οστική νόσος Βιοχημικές διαταραχές 1. Moe S, et al. Kidney Int. 2006;69: ; 2. Goodman WG. Semin Dial. 2004;17: ; 3. National Kidney Foundation. Am J Kidney Dis. 2003;42(suppl 3):S1-S201; 4. Goodman WG, et al. Kidney Int. 2008;74: ; 5. Urena Torres P, et al. Kidney Int. 2008;73:
:S1-S201; 4. Goodman WG, et al. Kidney Int. 2008;74: ; 5. Urena Torres P, et al. Kidney Int. 2008;73:")
5
Χαρακτηριστικά των Α.Ε. ΕΣΩ ΧΙΤΩΝΑ ΜΕΣΟΥ ΧΙΤΩΝΑ
Μεγάλες και μεσαίου μεγέθους αρτηρίες Εστιακή βλάβη Μέρος της διαδικασίας αθηροσκλήρυνσης Σχετίζεται με παραδοσιακούς παράγοντες κινδύνου Όλων των μεγεθών αρτηρίες Διάχυτη βλάβη Επακόλουθο γήρανσης Σχετίζεται με ΣΔ, ΧΝΑ Αμφότερες απαντώνται σε ασθενείς με ΧΝΑ

6
Επασβέστωση της έσω στοιβάδας Επασβέστωση της μέσης στοιβάδας
Αθηροσκλήρυνση Επασβέστωση της μέσης στοιβάδας Αρτηριοσκλήρυνση

7
Κλινική σημασία των Α.Ε. Αρτηριακές επασβεστώσεις Αρτηριοσκλήρυνση
Επασβεστώσεις της έσω στοιβάδας Επασβεστώσεις της μέσης στοιβάδας Αρτηριοσκλήρυνση Αθηροσκλήρυνση Δυσκαμψία Στένωση, αποφράξεις Συστολική πίεση, ταχύτητα σφυγμικού κύματος και εύρους σφυγμού Έμφραγμα, ισχαιμία Μεταβολή της αιμάτωσης των στεφανιαίων αγγείων, υπερτροφία της αριστερής κοιλίας London GM et al, Curr Opin Nephrol Hypertens. 2005;14:525–531

8
Νεότερα δεδομένα που αύξησαν το ενδιαφέρον για τις Α.Ε.
Σχετίζονται με αυξημένη θνητότητα και νοσηρότητα Τα λεία μυϊκά κύτταρα μπορούν να μεταστραφούν σε κύτταρα με οστεοβλαστική δραστηριότητα Πρωτεΐνες «κλειδιά» ρυθμίζουν ή εμποδίζουν τις Α.Ε. Συσχέτιση ανάμεσα σε ΧΝΑ, οστική επασβέστωση και αγγειακή επασβέστωση Παρεμβάσεις για αντιμετώπιση της νεφρικής οστεοδυστροφίας, επιταχύνουν την εξέλιξη των Α.Ε.

9
Ο κίνδυνος ασβεστοποίησης αυξάνεται στους αιμοκαθαιρόμενους ασθενείς
500 1000 1500 2000 2500 28-39 40-49 50-59 60-69 Ηλικία (έτη) Μέση τιμή ασβεστίου στη στεφανιαία αρτηρία Χωρίς Κ/Α Με Κ/Α Αιμ/θαρση
 Μέση τιμή ασβεστίου στη στεφανιαία αρτηρία. Χωρίς Κ/Α. Με Κ/Α. Αιμ/θαρση.")
10
Eπασβεστώσεις στεφανιαίων σε HD ασθενείς
Key points: Kalpakian and Mehrotra recently summarized data from seven separate studies published between 2002 and 2005 evaluating patients on maintenance dialysis. Each study included the prevalence of detectable coronary artery disease in the population evaluated. The majority of patients in each study, from 53%–92%, exhibited detectable coronary artery calcification.1 Reference: Kalpakian MA, Mehrotra R. Semin Dial. 2007;20; N 37 205 71 43 104 53 101 % Diabetes Mellitus 0% 30% 34% 9% 38% 40% Adapted from Kalpakian MA, Mehrotra R. Semin Dial. 2007;20:

11
Επασβεστώσεις στεφανιαίων σε νέους HD ασθενείς
Calcification Score– by Age Calcification Score– by Duration of Dialysis (Years) 10,000 1,000 100 10 1 0.1 Key points: Approximately 50% of deaths among adults undergoing regular dialysis is due to cardiovascular disease.1 The maintenance dialysis population also includes children and young adults (< 30 years of age), but less is known about the prevalence and extent of cardiovascular disease in this population.1 Using electron-beam computed tomography (EBCT) to screen for coronary artery calcification (CAC), Goodman and colleagues evaluated 39 patients (mean [±SD] age, 19 ± 7 years; range, 7 to 30) with ESRD on dialysis and 60 normal subjects (age 20–30).1 Both graphs on this slide refer solely to data from the 39 ESRD patients. As seen on the left-sided graph, the probability of calcification in ESRD patients increased as a function of age. None of the 23 ESRD patients younger than 20 years of age had evidence of CAC, but it was present in 14 of 16 patients 20–30 years of age. (Three out of 60 normal subjects had calcification).1 Compared to patients without calcification, patients with calcification were older (26 ± 3 vs 15 ± 5 years, P < 0.001) and had been undergoing dialysis for longer (14 ± 5 vs 4 ± 4 years, P < 0.001).1 The probability of calcification increased as a function of duration of dialysis as seen on the graph to the right.1 The stepped dashed line indicates the proportion of patients with evidence of coronary-artery calcification within each interval of approximately 4 years. The curved line reflects estimates derived by logistic-regression analysis.1 In addition, mean serum phosphorous and calcium-phosphorous product were higher in patients with CAC.1 Reference: Goodman WG, et al. N Engl J Med. 2000;342: The stepped dashed line indicates the proportion of patients with evidence of coronary-artery calcification within each interval of approximately 4 years. The curved line reflects estimates derived by logistic- regression analysis. N = 39 "Young adult" in the study was defined as <30 years of age. Coronary-artery calcification assessed by electron-beam computed tomography (CT). Adapted from Goodman WG, et al. N Engl J Med. 2000;342:
 10,000. 1, Key points: Approximately 50% of deaths among adults undergoing regular dialysis is due to cardiovascular disease.1 The maintenance dialysis population also includes children and young adults (< 30 years of age), but less is known about the prevalence and extent of cardiovascular disease in this population.1 Using electron-beam computed tomography (EBCT) to screen for coronary artery calcification (CAC), Goodman and colleagues evaluated 39 patients (mean [±SD] age, 19 ± 7 years; range, 7 to 30) with ESRD on dialysis and 60 normal subjects (age 20–30).1. Both graphs on this slide refer solely to data from the 39 ESRD patients. As seen on the left-sided graph, the probability of calcification in ESRD patients increased as a function of age. None of the 23 ESRD patients younger than 20 years of age had evidence of CAC, but it was present in 14 of 16 patients 20–30 years of age. (Three out of 60 normal subjects had calcification).1 Compared to patients without calcification, patients with calcification were older (26 ± 3 vs 15 ± 5 years, P < 0.001) and had been undergoing dialysis for longer (14 ± 5 vs 4 ± 4 years, P < 0.001).1. The probability of calcification increased as a function of duration of dialysis as seen on the graph to the right.1 The stepped dashed line indicates the proportion of patients with evidence of coronary-artery calcification within each interval of approximately 4 years. The curved line reflects estimates derived by logistic-regression analysis.1 In addition, mean serum phosphorous and calcium-phosphorous product were higher in patients with CAC.1. Reference: Goodman WG, et al. N Engl J Med. 2000;342: The stepped dashed line indicates the proportion of patients with evidence of coronary-artery calcification within each interval of approximately 4 years. The curved line reflects estimates derived by logistic- regression analysis. N = 39. Young adult in the study was defined as <30 years of age. Coronary-artery calcification assessed by electron-beam computed tomography (CT). Adapted from Goodman WG, et al. N Engl J Med. 2000;342:")
12
Θνητότητα και Α.Ε. σε HD ασθενείς
1.00 NC 0.75 NC = no calcification (n = 73) P < 0.001 All-Cause Survival 0.50 AMC AMC = arterial medial calcification (n = 54) P < 0.01 0.25 AIC 0.00 AIC = arterial intimal calcification (n = 75) 25 50 75 100 1.00 NC P < 0.01 0.75 Key points: A number of studies have linked arterial calcification with cardiovascular morbidity and mortality in CKD patients. However, most have not differentiated between type of calcification (ie, intimal versus medial). London and colleagues differentiated between these two types of calcification in a study of 202 maintenance haemodialysis patients using soft-tissue native radiograms of the pelvis and thigh.1 The presence and type of arterial calcification was evaluated for its prognostic value in predicting all-cause or cardiovascular mortality.1 According to their analyses, arterial intimal (AIC) and medial (AMC) calcification were both associated with an increased risk in all-cause and cardiovascular mortality.1 Background: Of the 73 deaths that occurred during the follow-up period, 46 were due to cardiovascular causes.1 All-cause mortality was independently and significantly associated with calcification: Risk ratios (RRs) for the AMC versus no calcification (NC) group was 15.7 (4.8–51.4; P < ) and for the AIC versus NC group was 4.85 (1.68–14.10; P = ).1 Similarly, cardiovascular mortality was independently and significantly associated with calcification: RR for the AMC versus NC group was 45.7 (9.75–213.0; P < ) and for the AIC versus NC group was 7.50 (1.59–35.5; P = ).1 In this study, intimal calcification was predominantly observed in older patients with a history of diabetes and atherosclerosis and atherosclerotic complications before starting haemodialysis. It was additionally associated with typical risk factors associated with atherosclerotic disease.1 Medial calcification was observed in young and middle-age patients without conventional atherosclerotic risk factors and was closely associated with duration of haemodialysis and calcium phosphate disorders.1 Reference: London GM, et al. Nephrol Dial Transplant. 2003;18: AMC Cardiovascular Survival 0.50 P < 0.001 AIC 0.25 0.00 25 50 75 100 N = 202 Time (months) London et al, Nephrol Dial Transplant 2003;18:
 P < All-Cause Survival AMC. AMC = arterial medial calcification (n = 54) P < AIC AIC = arterial intimal calcification (n = 75) NC. P < Key points: A number of studies have linked arterial calcification with cardiovascular morbidity and mortality in CKD patients. However, most have not differentiated between type of calcification (ie, intimal versus medial). London and colleagues differentiated between these two types of calcification in a study of 202 maintenance haemodialysis patients using soft-tissue native radiograms of the pelvis and thigh.1 The presence and type of arterial calcification was evaluated for its prognostic value in predicting all-cause or cardiovascular mortality.1 According to their analyses, arterial intimal (AIC) and medial (AMC) calcification were both associated with an increased risk in all-cause and cardiovascular mortality.1. Background: Of the 73 deaths that occurred during the follow-up period, 46 were due to cardiovascular causes.1 All-cause mortality was independently and significantly associated with calcification: Risk ratios (RRs) for the AMC versus no calcification (NC) group was 15.7 (4.8–51.4; P < ) and for the AIC versus NC group was 4.85 (1.68–14.10; P = ).1 Similarly, cardiovascular mortality was independently and significantly associated with calcification: RR for the AMC versus NC group was 45.7 (9.75–213.0; P < ) and for the AIC versus NC group was 7.50 (1.59–35.5; P = ).1. In this study, intimal calcification was predominantly observed in older patients with a history of diabetes and atherosclerosis and atherosclerotic complications before starting haemodialysis. It was additionally associated with typical risk factors associated with atherosclerotic disease.1 Medial calcification was observed in young and middle-age patients without conventional atherosclerotic risk factors and was closely associated with duration of haemodialysis and calcium phosphate disorders.1. Reference: London GM, et al. Nephrol Dial Transplant. 2003;18: AMC. Cardiovascular Survival P < AIC N = 202. Time (months) London et al, Nephrol Dial Transplant 2003;18:")
13
Cardiovascular Calcification and Mortality in Dialysis Patients
Score ranges from 0 (absence of calcium deposits) to 4 (calcifications present in all arterial segments examined) Arterial sites studied included common carotid, abdominal aorta, iliofemoral axis, and legs Calcification Score 1 2 3 4 Probability of Survival Duration of Follow-up (months) 1.00 0.75 0.00 0.25 0.50 20 40 60 80 Key points: The presence and extent of vascular calcifications are strong predictors of cardiovascular and all-cause mortality, as demonstrated in this study of 110 patients with stable end-stage renal disease receiving haemodialysis.1 The presence of calcifications was detected by ultrasound, and results were analyzed semiquantitatively as a score that ranged from 0 (absence of calcium deposits) to 4 (calcifications present in all arterial segments examined). Arterial sites studied included common carotid, abdominal aorta, iliofemoral axis, and legs.1 The results indicated a clear and significant relationship between the calcification score and both cardiovascular and all-cause mortality. This graph represents the results for all-cause mortality in the 110 dialysis patients.1 Background: Patients had all been receiving haemodialysis for ≥ 3 months, and had no clinical cardiovascular disease during the 6 months preceding study entry.1 One limitation of this study is the semiquantitative evaluation of calcification using a scoring system for presence or absence of calcification.1 Reference: Blacher J, et al. Hypertension. 2001;38: N = 110 x2 = 42.66 P < 0,0001 comparison between curves Adapted from Blacher et al, Hypertension. 2001;38:
 to 4 (calcifications present in all arterial segments examined) Arterial sites studied included common carotid, abdominal aorta, iliofemoral axis, and legs. Calcification. Score Probability of Survival. Duration of Follow-up (months) Key points: The presence and extent of vascular calcifications are strong predictors of cardiovascular and all-cause mortality, as demonstrated in this study of 110 patients with stable end-stage renal disease receiving haemodialysis.1 The presence of calcifications was detected by ultrasound, and results were analyzed semiquantitatively as a score that ranged from 0 (absence of calcium deposits) to 4 (calcifications present in all arterial segments examined). Arterial sites studied included common carotid, abdominal aorta, iliofemoral axis, and legs.1 The results indicated a clear and significant relationship between the calcification score and both cardiovascular and all-cause mortality. This graph represents the results for all-cause mortality in the 110 dialysis patients.1. Background: Patients had all been receiving haemodialysis for ≥ 3 months, and had no clinical cardiovascular disease during the 6 months preceding study entry.1 One limitation of this study is the semiquantitative evaluation of calcification using a scoring system for presence or absence of calcification.1. Reference: Blacher J, et al. Hypertension. 2001;38: N = 110. x2 = P < 0,0001 comparison between curves. Adapted from Blacher et al, Hypertension. 2001;38:")
14
Μηχανισμοί σχηματισμού των Α.Ε.
Αυξημένα επίπεδα ουραιμικών παραγόντων Αγγειακό λείο μυϊκό κύτταρο Υπερφωσφαταιμία Υψηλά επίπεδα Ca Αυξημένο Ca x P Promoters Cbfa-1 BMP-2 Matrix Deposition Χαμηλά επίπεδα αναστολέων •Fetuin-A Matrix Gla Protein

15
Καρδιαγγειακή νοσηρότητα στη ΧΝΑ
Υπέρταση Δυσλιπιδαιμία Κάπνισμα Οικογενειακό ιστορικό Παχυσαρκία Παραδοσιακοί παράγοντες κινδύνου Διαβήτης Μη-παραδοσιακοί παράγοντες κινδύνου Δείκτες φλεγμονής (CRP, IL-6, TNF) Οξειδωτικό stress Κακή διατροφή Ανεπάρκεια Fetuin-A Αυξημένη πρόσληψη Ca Αυξημένα επίπεδα PTH Διαταραχή μεταβολισμού των αλάτων Busch et al, Kidney Int. 2004;66: Reynolds et al, J Am Soc Nephrol. 2005;16: Mezzano et al, Kidney Int. 2001;60: Kalantar-Zadeh, Semin Dial. 2005;18: Menon et al. Kidney Int. 2005;68: Hackam et al, JAMA. 2003;290: Fruchart et al, Circulation. 2004;109(suppl III):15-19
 Οξειδωτικό stress. Κακή διατροφή. Ανεπάρκεια Fetuin-A. Αυξημένη πρόσληψη Ca. Αυξημένα επίπεδα PTH. Διαταραχή μεταβολισμού των αλάτων. Busch et al, Kidney Int. 2004;66: Reynolds et al, J Am Soc Nephrol. 2005;16: Mezzano et al, Kidney Int. 2001;60: Kalantar-Zadeh, Semin Dial. 2005;18: Menon et al. Kidney Int. 2005;68: Hackam et al, JAMA. 2003;290: Fruchart et al, Circulation. 2004;109(suppl III):")
16
Απέκκριση φωσφόρου και Α.Ε.
Data from the Seattle Kidney Study (n=25, eGFR = 41 mL/min, prevalence CAC = 76%) show that CAC (measured by EBCT) and urinary P excretion are significantly correlated1 In 132 pts CKD 1–5 followed for 4 years, death rate was associated with CKD stage (p<0.01), BSAP (marker of bone formation; p=0,03) and TRAP-5b (marker of bone resorption; p=0,05)2
 show that CAC (measured by EBCT) and urinary P excretion are significantly correlated1. In 132 pts CKD 1–5 followed for 4 years, death rate was associated with CKD stage (p<0.01), BSAP (marker of bone formation; p=0,03) and TRAP-5b (marker of bone resorption; p=0,05)2.")
17
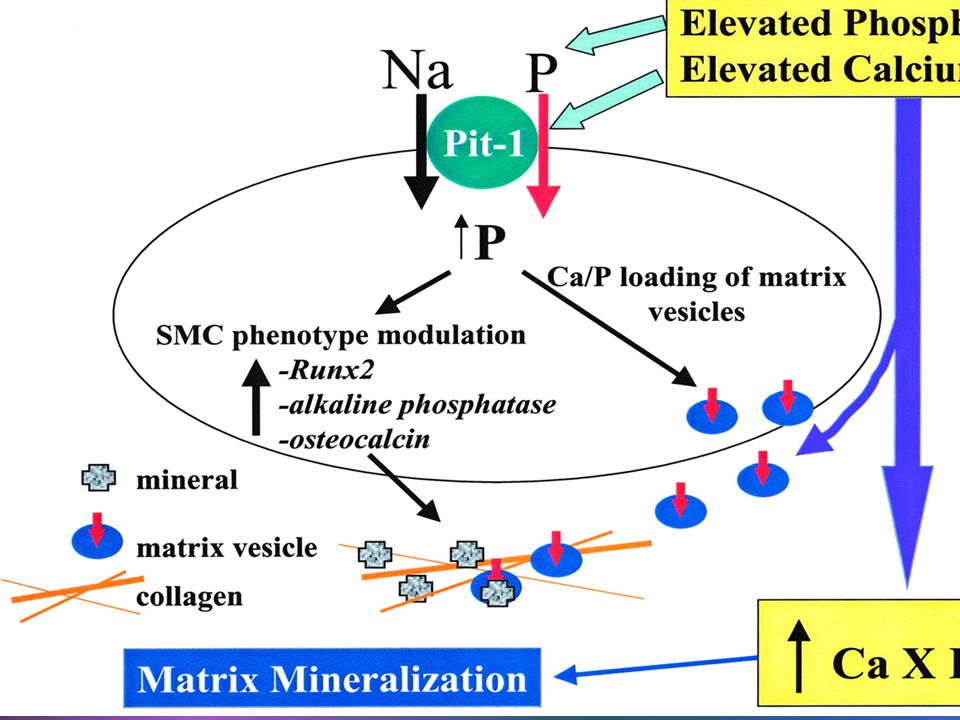
High P levels drive vascular calcification via 2 processes:
They can transform vascular smooth muscle cells into active mediators of calcification They drive Ca-P deposition in osseous and extra-osseous sites

19
Μείωση νεφρικής λειτουργίας και διαταραχές επιπέδων PTH, P, Ca
CKD 2 CKD 3 CKD 4 & 5 Calcium < 8.4 mg/dL Phosphorous > 4.6 mg/dL Intact PTH > 65 pg/mL In an effort to quantify the prevalence of mineral metabolism disorders in CKD patients, the Study for the Evaluation of Early Kidney Disease (SEEK) trial prospectively examined serum iPTH, vitamin D, calcium, and phosphorous levels in 1814 community-based patients across a range of estimated glomerular filtration rates (eGFRs) based on a single baseline serum creatinine.1 Serum calcium and phosphorous remained relatively stable until eGFR values decreased to < 40 mL/min/1.73 m2.1 Hyperparathyroidism, defined as an iPTH > 65 pg/mL, was present in approximately 12% of those with eGFR values > 80 mL/min/1.73 m2, 17% of those with values of 70–79 mL/min/1.73 m2, 21% of those with values of 60 – 69 mL/min/1.73 m2, and 56% of those with values < 60 mL/min/1.73 m2.1 Low serum vitamin D levels and elevated PTH levels were common early in disease, with vitamin D continuing to decline and PTH continuing to increase as eGFR declined.1 Low serum vitamin D, defined as < 22 pg/mL, was seen in 13% of patients with an eGFR > 80 mL/min/1.73 m2, and rose to > 60% in those with an eGFR < 30 mL/min/1.73 m2 (not shown in this figure). 1 Background: Patients were screened between June and October 2004 across 153 centers. 1,814 (866 male and 948 female) of 5,255 screened met the entry criteria (eGFR values calculated using the most recent serum creatinine as documented in the chart of < 60 mL/min/1.73 m2).1 Based on discrepancies between the chart-documented serum creatinine and the baseline creatinine measured at study entry, 23% or 405 patients included in this study had an eGFR > 60 mL/min/1.73 m2. Exclusion criteria included renal replacement therapy, a history of primary parathyroid disease, or use of any prescription-based vitamin D therapy in the 12 months before screening.1 Study limitations include age-weighting of the study population (71% of the sample was over 65 years old) and kidney function (eGFR) was defined by a single creatinine measure.1 Reference: Levin A, et al. Kidney Int. 2007;71:31-38. N = 1,814 Adapted from Levin et al, Kidney Int. 2007;71:31-38.
 trial prospectively examined serum iPTH, vitamin D, calcium, and phosphorous levels in 1814 community-based patients across a range of estimated glomerular filtration rates (eGFRs) based on a single baseline serum creatinine.1. Serum calcium and phosphorous remained relatively stable until eGFR values decreased to < 40 mL/min/1.73 m2.1 Hyperparathyroidism, defined as an iPTH > 65 pg/mL, was present in approximately 12% of those with eGFR values > 80 mL/min/1.73 m2, 17% of those with values of 70–79 mL/min/1.73 m2, 21% of those with values of 60 – 69 mL/min/1.73 m2, and 56% of those with values < 60 mL/min/1.73 m2.1 Low serum vitamin D levels and elevated PTH levels were common early in disease, with vitamin D continuing to decline and PTH continuing to increase as eGFR declined.1 Low serum vitamin D, defined as < 22 pg/mL, was seen in 13% of patients with an eGFR > 80 mL/min/1.73 m2, and rose to > 60% in those with an eGFR < 30 mL/min/1.73 m2 (not shown in this figure). 1. Background: Patients were screened between June and October 2004 across 153 centers. 1,814 (866 male and 948 female) of 5,255 screened met the entry criteria (eGFR values calculated using the most recent serum creatinine as documented in the chart of < 60 mL/min/1.73 m2).1 Based on discrepancies between the chart-documented serum creatinine and the baseline creatinine measured at study entry, 23% or 405 patients included in this study had an eGFR > 60 mL/min/1.73 m2. Exclusion criteria included renal replacement therapy, a history of primary parathyroid disease, or use of any prescription-based vitamin D therapy in the 12 months before screening.1 Study limitations include age-weighting of the study population (71% of the sample was over 65 years old) and kidney function (eGFR) was defined by a single creatinine measure.1. Reference: Levin A, et al. Kidney Int. 2007;71: N = 1,814. Adapted from Levin et al, Kidney Int. 2007;71:")
20
Θνητότητα και επίπεδα PTH, Ca, P στη ΧΝΑ
Unadjusted Case-mix Case-mix & MICS 3.0 2.0 4.0 3.0 2.0 1.5 2.0 1.5 All-Cause Death Hazard Ratio 1.0 Key points: Kalantar-Zadeh and colleagues prospectively analyzed data from 58,058 mixed incident/prevalent haemodialysis (HD) patients for any associations between survival and markers of mineral metabolism.1 Investigators evaluated both baseline values of and longitudinal changes over 2 years in serum phosphorous, calcium, and PTH and whether associations between these baseline and/or time-dependent values and mortality were seen as compared to the respective reference groups (the group with a hazard ratio (HR) of 1.0).1 The time-dependent model evaluating longitudinal changes illustrated on this slide and adjusted for case-mix and malnutrition-inflammation-cachexia syndrome (MICS) highlights the independent associations seen between high levels of iPTH, calcium, and phosphorous and an increased risk of mortality.1 These associations were seen after adjusting for the use of vitamin D.1 Levels of PTH below those recommended in the KDOQI™ guidelines (< 150 pg/mL) were also associated with an increased risk of death.1 Further, a fall or rise in serum calcium > 0.6 mg/dL, or an excessive change in serum phosphorous in 6 months was associated with higher death risk in patients whose baseline value was within the KDOQI™-recommended range.1 KDOQI™ is a trademark of the National Kidney Foundation, Inc. Background: The data analyzed were collected between July 2001 and June 2003 from a historical cohort of all maintenance HD patients from virtually all DaVita dialysis clinics in the US.1 For this study, all repeated measure laboratory data within a given calendar quarter were averaged to give a quarterly mean value; therefore, up to eight values were available over the 2-year study period.1 HRs were calculated to evaluate any association between 2-year survival and surrogates of bone disease.1 Reference: Kalantar-Zadeh K, et al. Kidney Int. 2006;70: 1.0 1 0.9 0.7 0.7 400– 499.9 500– 599.9 600– 699.9 ≥ 700 < 100 100– 199.9 200– 299.9 300– 399.9 9.5– 9.99 10.0– 10.49 10.5– 10.99 ≥ 11.0 < 8.0 8.0– 8.49 8.5– 8.99 9.0– 9.49 6.0– 6.99 7.0– 7.99 8.0– 8.99 ≥ 9.0 < 3.0 3.0– 3.99 4.0– 4.99 5.0– 5.99 Serum Intact PTH (pg/mL) Corrected Serum Calcium (mg/dL) Serum Phosphorous (mg/dL) Cox time-dependent model. HD = haemodialysis, CKD = chronic kidney disease, MICS = malnutrition-inflammation-cachexia syndrome N = 58,058 Adapted from Kalantar-Zadeh et al, Kidney Int. 2006;70:771–780.
 patients for any associations between survival and markers of mineral metabolism.1 Investigators evaluated both baseline values of and longitudinal changes over 2 years in serum phosphorous, calcium, and PTH and whether associations between these baseline and/or time-dependent values and mortality were seen as compared to the respective reference groups (the group with a hazard ratio (HR) of 1.0).1 The time-dependent model evaluating longitudinal changes illustrated on this slide and adjusted for case-mix and malnutrition-inflammation-cachexia syndrome (MICS) highlights the independent associations seen between high levels of iPTH, calcium, and phosphorous and an increased risk of mortality.1 These associations were seen after adjusting for the use of vitamin D.1. Levels of PTH below those recommended in the KDOQI™ guidelines (< 150 pg/mL) were also associated with an increased risk of death.1 Further, a fall or rise in serum calcium > 0.6 mg/dL, or an excessive change in serum phosphorous in 6 months was associated with higher death risk in patients whose baseline value was within the KDOQI™-recommended range.1. KDOQI™ is a trademark of the National Kidney Foundation, Inc. Background: The data analyzed were collected between July 2001 and June 2003 from a historical cohort of all maintenance HD patients from virtually all DaVita dialysis clinics in the US.1 For this study, all repeated measure laboratory data within a given calendar quarter were averaged to give a quarterly mean value; therefore, up to eight values were available over the 2-year study period.1 HRs were calculated to evaluate any association between 2-year survival and surrogates of bone disease.1. Reference: Kalantar-Zadeh K, et al. Kidney Int. 2006;70: – – – ≥ 700. < – – – – – – ≥ < – – – – – – ≥ 9.0. < – – – Serum Intact PTH (pg/mL) Corrected Serum Calcium (mg/dL) Serum Phosphorous (mg/dL) Cox time-dependent model. HD = haemodialysis, CKD = chronic kidney disease, MICS = malnutrition-inflammation-cachexia syndrome. N = 58,058. Adapted from Kalantar-Zadeh et al, Kidney Int. 2006;70:771–780.")
21
PTH και επασβεστώσεις στεφανιαίας
2000 1500 1000 500 1872.7 1202.8 Agatston CAC score 866.4 624.7 0-150 >600 Serum iPTH (pg/mL) p=0,01
 p=0,01.")
22
Επίπεδα PTH και 1,25(ΟΗ)2D3 και νεφρική λειτουργία
Median Values of Serum 1,25(OH)2D3 and iPTH by GFR1 CKD 2 CKD 3 CKD 4 & 5 iPTH (pg/mL) 1,25(OH)2D3 (pg/mL) Key Points Mineral metabolism disturbances start early in the course of CKD, and changes in serum levels of PTH, and 1,25(OH)2D3 are observed with decline in kidney function. The top figure shows the median values of 1,25(OH)2D3 and PTH by level of eGFR in the Study for the Evaluation of Early Kidney Disease (SEEK). These data show an early rise in PTH measured as iPTH accompanied by a decrease in serum 1,25(OH)2D3. Hyperparathyroidism (iPTH > 65 pg/mL) began to occur at eGFR levels of approximately 45 mL/min/1.73 m2. 1,25(OH)2D3 began to approach levels deemed deficient (22 pg/mL) at this GFR also. Background SEEK was a cross-sectional, prospective, community-based, noninterventional cohort study, which was designed to examine the abnormalities in serum PTH, vitamin D, calcium, and phosphorous in patients with CKD. Patients were screened between June and October 2004 across 153 centers. Out of 5,255 patients screened, 1,814 (866 male and 948 female) met the entry criteria (eGFR values calculated using the most recent serum creatinine as documented in the chart of < 60 mL/min/1.73 m2).1 Based on discrepancies between the chart-documented serum creatinine and the baseline creatinine measured at study entry, 23%, or 405 patients included in this study, had an eGFR > 60 mL/min/1.73 m2. Exclusion criteria included renal replacement therapy, a history of primary parathyroid disease, or use of any prescription-based vitamin D therapy in the 12 months before screening. Study limitations include age-weighting of the study population (71% of the sample was over 65 years old) and kidney function (eGFR) was defined by a single creatinine measure. In addition, no longitudinal data were provided, reported here, thus relationships between the variables and different eGFR levels may change over time. The CKD population was from outpatient nephrology clinics in Massachusetts General Hospital, University of Maryland, Baltimore. References Levin A, et al. Kidney Int. 2007;71:31-38. iPTH 1,25(OH)2D3 GFR (mL/min) N = 1,814 iPTH = intact PTH; GFR = glomerular filtration rate. 1. Levin et al. Kidney Int. 2007;71:31-38.
2D3 and iPTH by GFR1. CKD 2. CKD 3. CKD 4 & 5. iPTH (pg/mL) 1,25(OH)2D3 (pg/mL) Key Points. Mineral metabolism disturbances start early in the course of CKD, and changes in serum levels of PTH, and 1,25(OH)2D3 are observed with decline in kidney function. The top figure shows the median values of 1,25(OH)2D3 and PTH by level of eGFR in the Study for the Evaluation of Early Kidney Disease (SEEK). These data show an early rise in PTH measured as iPTH accompanied by a decrease in serum 1,25(OH)2D3. Hyperparathyroidism (iPTH > 65 pg/mL) began to occur at eGFR levels of approximately 45 mL/min/1.73 m2. 1,25(OH)2D3 began to approach levels deemed deficient (22 pg/mL) at this GFR also. Background. SEEK was a cross-sectional, prospective, community-based, noninterventional cohort study, which was designed to examine the abnormalities in serum PTH, vitamin D, calcium, and phosphorous in patients with CKD. Patients were screened between June and October 2004 across 153 centers. Out of 5,255 patients screened, 1,814 (866 male and 948 female) met the entry criteria (eGFR values calculated using the most recent serum creatinine as documented in the chart of < 60 mL/min/1.73 m2).1. Based on discrepancies between the chart-documented serum creatinine and the baseline creatinine measured at study entry, 23%, or 405 patients included in this study, had an eGFR > 60 mL/min/1.73 m2. Exclusion criteria included renal replacement therapy, a history of primary parathyroid disease, or use of any prescription-based vitamin D therapy in the 12 months before screening. Study limitations include age-weighting of the study population (71% of the sample was over 65 years old) and kidney function (eGFR) was defined by a single creatinine measure. In addition, no longitudinal data were provided, reported here, thus relationships between the variables and different eGFR levels may change over time. The CKD population was from outpatient nephrology clinics in Massachusetts General Hospital, University of Maryland, Baltimore. References. Levin A, et al. Kidney Int. 2007;71: iPTH. 1,25(OH)2D3. GFR (mL/min) N = 1,814. iPTH = intact PTH; GFR = glomerular filtration rate. 1. Levin et al. Kidney Int. 2007;71:")
23
Βιταμίνη D και ΧΝΑ Η αυξημένη νοσηρότητα και θνητότητα σχετίζεται με μειωμένα επίπεδα βιτ. D Barreto et al 2009 Τα μειωμένα επίπεδα 25βιτ.D και 1,25βιτ.D έχουν αρνητική συσχέτιση με την εμφάνιση απώλειας της ελαστικότητας του τοιχώματος των αρτηριών London et al 2003 Σε παιδιά τα επίπεδα 1,25βιτ. D συσχετίζονται με αγγειακές επασβεστώσεις Shroff et al 2007

24
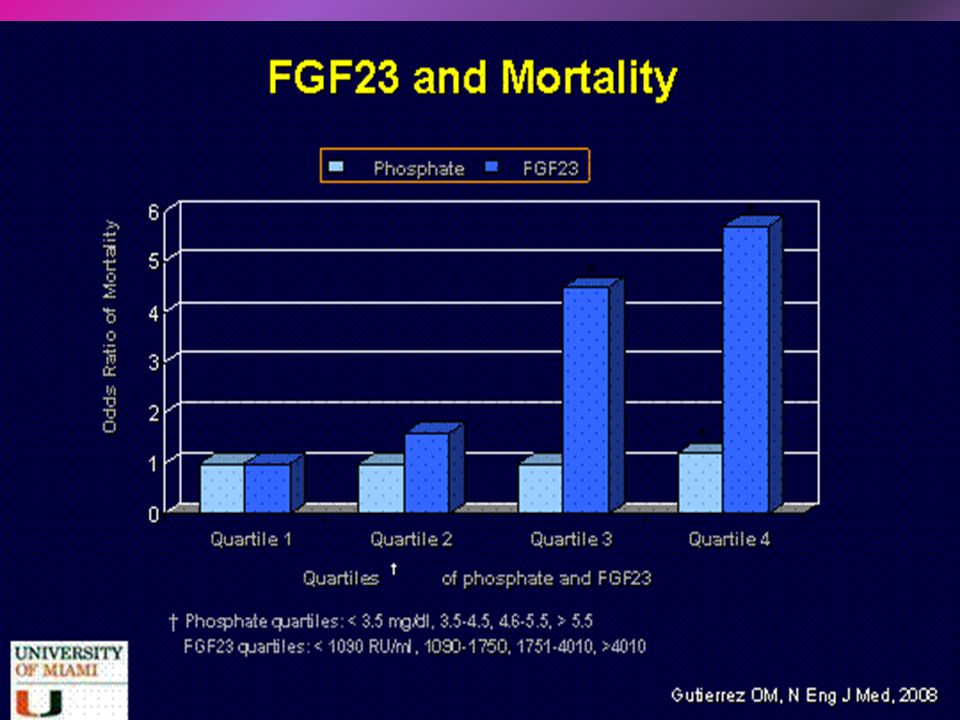
FGF23-Klotho Ελέγχει την απέκκριση του Ρ από τους νεφρούς μέσω ρύθμισης του συμμεταφορέα Να-Ρ Τα επίπεδα FGF23 αυξάνουν από τα αρχικά στάδια της ΧΝΑ Υψηλά επίπεδα FGF23 σχετίζονται με αυξημένη θνητότητα Σε πειραματόζωα η FGF23 επιδρά στον οστικό μεταβολισμό ανεξάρτητα από τα επίπεδα Ρ Sitara et al 2008 Σε πειραματόζωα η Κlotho φαίνεται να εμποδίζει τη πρόσληψη Ρ από τα λ.μ.κ. με ευεργετικά αποτελέσματα στη δημιουργία επασβεστώσεων Ηu et al 2011

26
Επίπεδα FGF23 και νεφρική λειτουργία
4 5 6 7 CKD 2 CKD 3 CKD 4 & 5 Mean Log FGF-23* Key Points Mineral metabolism disturbances start early in the course of CKD, and changes in serum levels of FGF-23, PTH, and 1,25(OH)2D3 are observed with decline in kidney function. The figure shows the mean concentrations of FGF-23 according to level of kidney function. Note that this data is on a log scale. Serum FGF-23 levels significantly increased as kidney function declined (P < 0.001). FGF-23 levels were above the normal range in patients with mild to moderate CKD (eGFR 30–60 mL/min/1.73 m2). Background SEEK was a cross-sectional, prospective, community-based, non-interventional cohort study, which was designed to examine the abnormalities in serum PTH, vitamin D, calcium, and phosphorous in patients with CKD. Gutiérrez et al performed a multivariable adjusted regression analysis in a cross-sectional study of 162 patients with predialysis CKD compared with 58 control subjects to determine the effects of increased levels of FGF-23 on left ventricular hypertrophy and CAC in patients with CKD. The CKD population was from outpatient nephrology clinics in the Baltimore Veterans Administration Medical Center. References Gutiérrez OM, et al. Circulation. 2009;119: FGF-23 > 60 60–45 44–30 < 30 eGFR (mL/min/1,73 m2) N = 220 *Normal range for FGF-23 indicated by shaded area; GFR = glomerular filtration rate; eGFR = estimated GFR. Adapted from Gutiérrez et al, Circulation. 2009;119:
2D3 are observed with decline in kidney function. The figure shows the mean concentrations of FGF-23 according to level of kidney function. Note that this data is on a log scale. Serum FGF-23 levels significantly increased as kidney function declined (P < 0.001). FGF-23 levels were above the normal range in patients with mild to moderate CKD (eGFR 30–60 mL/min/1.73 m2). Background. SEEK was a cross-sectional, prospective, community-based, non-interventional cohort study, which was designed to examine the abnormalities in serum PTH, vitamin D, calcium, and phosphorous in patients with CKD. Gutiérrez et al performed a multivariable adjusted regression analysis in a cross-sectional study of 162 patients with predialysis CKD compared with 58 control subjects to determine the effects of increased levels of FGF-23 on left ventricular hypertrophy and CAC in patients with CKD. The CKD population was from outpatient nephrology clinics in the Baltimore Veterans Administration Medical Center. References. Gutiérrez OM, et al. Circulation. 2009;119: FGF-23. > –45. 44–30. < 30. eGFR (mL/min/1,73 m2) N = 220. *Normal range for FGF-23 indicated by shaded area; GFR = glomerular filtration rate; eGFR = estimated GFR. Adapted from Gutiérrez et al, Circulation. 2009;119:")
27
Μηχανισμοί αγγειακών επασβεστώσεων
1. Loss of inhibition MGP OPN Fetuin/a2-HS- Mycoprotein Pyrophosphate Others 3. Circulating nucleational complexes 4. Cell death 2. Induction of bone formation Vascular osteoblast/ chondrocyte-like cells Vascular calcification Remodeling bone Apoptotic bodies and necrotic debris Ca/Pi loaded Matrix vesicles Pi Lipids Inflammatory cytokines Hyperphosphatemia Hypercalcemia Ca × Pi RUNX2 MSX2

28
CKD Normal Active Inhibitors Active Inducers Active Inhibitors

29
Πιθανοί «επαγωγείς» και «αναστολείς» των Α.Ε.
Πιθανοί «επαγωγείς» και «αναστολείς» των Α.Ε. Αναστολείς Matrix Gla protein (MGP) Osteopontin(ΟΡΝ) Pyrophospate(PPi) Phosphonoformic acid (PFA) Parathyroid hormone–related protein (PTHrp) C-natriuretic protein High-density lipoprotein (HDL) BMP-7 Fetuin-Α Επαγωγείς Phosphate Uremic serum Core-binding factor alpha 1 (cbf1) Bone morphogenetic protein-2 (BMP-2) Interleukin-1 (IL-1) and IL-6 Type I collagen Cyclic adenosine monophosphate Oxidative stress Hypercalcemia
 Osteopontin(ΟΡΝ) Pyrophospate(PPi) Phosphonoformic acid (PFA) Parathyroid hormone–related protein (PTHrp) C-natriuretic protein. High-density lipoprotein (HDL) BMP-7. Fetuin-Α. Επαγωγείς. Phosphate. Uremic serum. Core-binding factor alpha 1 (cbf1) Bone morphogenetic protein-2 (BMP-2) Interleukin-1 (IL-1) and IL-6. Type I collagen. Cyclic adenosine monophosphate. Oxidative stress. Hypercalcemia.")
30
MGP ΒΜΡ-7 Εμποδίζει τον σχηματισμό κρυστάλλων απατίτη
Εμποδίζει τον σχηματισμό κρυστάλλων απατίτη Μειώνει δραστηριότητα ΒΜΡ-2 (και ΒΜΡ-4) συνδεόμενη απ’ ευθείας μαζί της Η βιταμίνη Κ είναι ουσιαστικός παράγων που ενέχεται στη παραγωγή της ΒΜΡ-7 Είναι μέλος της οικογένειας των TGF-β Προστατεύει από τη δημιουργία επασβεστώσεων Αυξημένα επίπεδα σε ασθενείς με ΧΝΑ Φαίνεται να ασκεί ανασταλτική δράση στην εξέλιξη της ΧΝΑ
 συνδεόμενη απ’ ευθείας μαζί της. Η βιταμίνη Κ είναι ουσιαστικός παράγων που ενέχεται στη παραγωγή της. ΒΜΡ-7. Είναι μέλος της οικογένειας των TGF-β. Προστατεύει από τη δημιουργία επασβεστώσεων. Αυξημένα επίπεδα σε ασθενείς με ΧΝΑ. Φαίνεται να ασκεί ανασταλτική δράση στην εξέλιξη της ΧΝΑ.")
31
FETUIN-A Pyrophosphate(PPi)
Δυνητικός αναστολέας του σχηματισμού υδροξυαπατίτη Σε αιμοκαθαιρόμενους ασθενείς τα μειωμένα επίπεδα σχετίζονται με αύξηση των επασβεστώσεων Σε ύπαρξη φλεγμονής μειώνονται τα επίπεδα της Pyrophosphate(PPi) Εμποδίζει τον σχηματισμό υδροξυαπατίτη Έλλειψη του ενζύμου ΕΝΡΡ-1, που ρυθμίζει την σύνθεση του, οδηγεί σε μαζικές επασβεστώσεις Σε αιμοκαθαιρόμενους ασθενείς μειωμένα επίπεδα, σε αντίστροφη σχέση με την έκταση των επασβεστώσεων
 Εμποδίζει τον σχηματισμό υδροξυαπατίτη. Έλλειψη του ενζύμου ΕΝΡΡ-1, που ρυθμίζει την σύνθεση του, οδηγεί σε μαζικές επασβεστώσεις. Σε αιμοκαθαιρόμενους ασθενείς μειωμένα επίπεδα, σε αντίστροφη σχέση με την έκταση των επασβεστώσεων.")
32
OPN Δυνητικός αναστολέας ανάπτυξης κρυστάλλων απατίτη
Έλλειψη ΟΡΝ οδηγεί σε εμφάνιση έκτοπων επασβεστώσεων Οι ασθενείς με ΧΝΑ παρουσιάζουν αυξημένα επίπεδα ΟΡΝ Σε καταστάσεις φλεγμονής παρουσιάζει αυξημένη δραστηριότητα, που ίσως ευνοεί τη δημιουργία αθηροσκληρυντικών αγγειακών βλαβών

33
OPG/RANKL-RANK Μέλος της οικογένειας των TNF receptor

34
Μέθοδοι διάγνωσης των Α.Ε.
Με απλή ακτινογραφία για τον έλεγχο της βαρύτητας των αγγειακών επασβεστώσεων Με αξονική τομογραφία δέσμης ηλεκτρονίων (EBCT) και αξονική τομογραφία πολλαπλών ανιχνευτών (MDCT) δεν διακρίνουν τον τύπο της επασβέστωσης Με υπερηχογραφική μέτρηση του πάχους του αρτηριακού έσω-μέσω χιτώνα και της ταχύτητας του σφυγμικού κύματος
 και αξονική τομογραφία πολλαπλών ανιχνευτών (MDCT) δεν διακρίνουν τον τύπο της επασβέστωσης. Με υπερηχογραφική μέτρηση του πάχους του αρτηριακού έσω-μέσω χιτώνα και της ταχύτητας του σφυγμικού κύματος.")
35
EBCT : Το πολύτιμο εργαλείο για την εκτίμηση της Στεφανιαίας Ασβεστοποίησης
Η Υπολογιστική Τομογραφία (CT) και το NMR scanning δεν προλαβαίνουν να οπτικοποιήσουν τον καρδιακό παλμό Ένας ολόκληρος κύκλος διαρκεί λιγότερο από 1 sec Δε μπορούν να ληφθούν εικόνες των στεφανιαίων αρτηριών σε χρόνο μεγαλύτερο του 1 sec Η ανίχνευση με EBCT λαμβάνει εικόνες σε 250 έως 750 ms Λαμβάνεται μία εικόνα ανά καρδιακό παλμό
 και το NMR scanning δεν προλαβαίνουν να οπτικοποιήσουν τον καρδιακό παλμό. Ένας ολόκληρος κύκλος διαρκεί λιγότερο από 1 sec. Δε μπορούν να ληφθούν εικόνες των στεφανιαίων αρτηριών σε χρόνο μεγαλύτερο του 1 sec. Η ανίχνευση με EBCT λαμβάνει εικόνες σε 250 έως 750 ms. Λαμβάνεται μία εικόνα ανά καρδιακό παλμό.")
36
RCA LADA

37
Αντιμετώπιση των Α.Ε. Έλεγχος μεταβολισμού των οστών
Έλεγχος μεταβολισμού των οστών Έλεγχος μεταβολισμού των αλάτων Άμεση στόχευση στη διαδικασία εξέλιξης των Α.Ε. Μπορεί η θεραπεία να υποστρέψει τις ήδη υπάρχουσες βλάβες; Έχει επίδραση η θεραπεία στη φυσιολογική ασβεστοποίηση;

38
Θεραπευτική φαρέτρα για την αντιμετώπιση των Α.Ε.
Δεσμευτικά φωσφόρου VDR ενεργοποιητές Ασβεστιομιμητικά Διφωσφονικά Άλλα: Στατίνες, sodium thiosulfate

39
Δεσμευτικά φωσφόρου και Α.Ε.
Vascular calcification progression in HD patients over 1 yr (TTG) Vascular calcification progression in predialysis patients
 Vascular calcification progression in predialysis patients.")
40
Θεραπεία (No. randomized)
Μελέτη Είδος πληθυσμού Διάρκεια Θεραπεία (No. randomized) Αποτελέσματα Chertow et al 2002 (TTG study) New HD 12 mo Sevelamer (99) vs. CaCO3 or CaOAc (101) ↑CAC and AC with CaCO3/CaOAc vs. sevelamer Braun et al 2004 Prevalent HD Sevelamer (55) vs. CaCO3 (59) ↑CAC and AC with CaCO3 vs. sevelamer Block et al 2005 (RIND study) Incident HD 18 mo Sevelamer (73) vs. CaCO3 or CaOAc (75) More rapid and severe CAC with CaCO3/CaOAc vs. sevelamer Russo et al 2007 Pre-Dialysis 24 mo PR diet + sevelamer (30) vs. PR diet + CaCO3 (30) vs. PR diet alone (30) CAC progression rate: PR diet > PR diet + CaCO3 > PR diet + sevelamer Barretto et al 2008 Sevelamer (52) vs. CaOAc (49) No difference in CAC progression with CaOAc or sevelamer Takei et al 2008 6 mo Sevelamer (22) vs. CaCO3 (20) ↑CAC progression with CaCO3 vs. sevelamer Qunibi et al 2008 (CARE-2 study) Sevelamer + statin (100) vs. CaOAc + statin (103)
 Αποτελέσματα. Chertow et al (TTG study) New HD. 12 mo. Sevelamer (99) vs. CaCO3 or CaOAc (101) ↑CAC and AC with CaCO3/CaOAc vs. sevelamer. Braun et al Prevalent HD. Sevelamer (55) vs. CaCO3 (59) ↑CAC and AC with CaCO3 vs. sevelamer. Block et al (RIND study) Incident. HD. 18 mo. Sevelamer (73) vs. CaCO3 or CaOAc (75) More rapid and severe CAC with CaCO3/CaOAc vs. sevelamer. Russo et al Pre-Dialysis. 24 mo. PR diet + sevelamer (30) vs. PR diet + CaCO3 (30) vs. PR diet alone (30) CAC progression rate: PR diet > PR diet + CaCO3 > PR diet + sevelamer. Barretto et al Sevelamer (52) vs. CaOAc (49) No difference in CAC progression. with CaOAc or sevelamer. Takei et al mo. Sevelamer (22) vs. CaCO3 (20) ↑CAC progression with CaCO3 vs. sevelamer. Qunibi et al (CARE-2 study) Sevelamer + statin (100) vs. CaOAc + statin (103)")
41
VDR ενεργοποιητές - Ασβεστιομιμητικά
Με ποιο μηχανισμό παρεμβαίνουν στην εξέλιξη των αγγειακών επασβεστώσεων: Διαφέρουν τα αποτελέσματα ανάλογα με τον χρησιμοποιούμενο VDR ενεργοποιητή:

42
Ενεργοποίηση των VDR και ευεργετικές δράσεις στη δημιουργία των Α.Ε.
Επασβέστωση VDR δράση Επαγωγείς Cbfa1 Type 1 collagen IL-1, IL-6 BMP-2 Αναστολείς MGP Osteopontin Type IV collagen

43
VDR ενεργοποιητές- Ασβεστιομιμητικά
Οι δόσεις καλσιτριόλης που απαιτούνται για μείωση της ΡΤΗ οδηγούν σε αύξηση των Α.Ε. Ο΄Νeil et al 2009 Σε πειραματικά μοντελα χαμηλές δόσεις καλσιτριόλης και παρακαλσιτόλης έχουν ευεργετική επίδραση στην εξέλιξη των Α.Ε., ενώ πολύ υψηλές δόσεις ευνοούν τον σχηματισμό Α.Ε. Mathew et al 2008 Μελέτες έχουν δείξει ότι οι διάφορες μορφές VDR ενεργοποιητών έχουν διαφορετική επίδραση στην εξέλιξη των Α.Ε. Mizobuchi et al 2007 Σε πειραματόζωα η χορήγηση ασβεστιομιμητικών φαίνεται να προστατεύει από την εμφάνιση Α.Ε. Lopez et al 2006 Ο συνδυασμός cinacalcet με χαμηλές δόσεις vit. D επιβραδύνει την εξέλιξη των Α.Ε. σε αιμοκαθαιρόμενους ασθενείς ADVANCE study 2010

44
VDR activators and Vascular Calcification in Uremic Rats
Aortic Ca content Aortic calcification † ‡ 45 Control Calcitriol 0.04 μg/kg 40 † ‡ 35 30 mg/g of wet wt. tissue 25 20 15 This study investigated whether treatment with VDR activators affects vascular calcification in rats. Uremic rats were given vehicle, calcitriol, doxercalciferol or paricalcitol three times a week for 1 month. There were no differences in serum Ca and P at the doses administered (the dosing ratios between paricalcitol and the vitamin D compounds reflect the clinical dosing ratios). Calcitriol significantly increased the serum Ca x P product and aortic Ca content. Paricalcitol had no effect on serum Ca and Ca x P product, but the same dose of doxercalciferol significantly increased the Ca x P product and the aortic Ca content, which was confirmed by von Kossa staining. To determine if this increase in aortic Ca was due to the increase in Ca x P product or to a differential effect of the two VDR activators on vascular calcification, the study was repeated using a lower dose of doxercalciferol (0.10 μg/kg) and a higher dose of paricalcitol (0.24 μg/kg). A lower doxercalciferol dose did not increase the Ca x P product but increased the aortic Ca content. A higher dose of paricalcitol still had no effect. Therefore, different VDR activators have different effects on vascular calcification in uremic rats. The effects are independent of the serum Ca x P product, suggesting independent mechanisms. 10 1a-OH-D μg/kg Paricalcitol 0.16 μg/kg 5 NC UC Calci- triol μg/kg 1α-OH-D μg/kg Pari- calcitol μg/kg *The different effects of VDR activators on vascular calcification cannot be accounted for by differences in Ca x P product NC, normal control; UC, uremic control p< by analysis of variance; †p<0.01 vs UC; ‡p<0.01 vs paricalcitol by post hoc, Scheffe test Mizobuchi M et al. Kidney Int 2007;72:709–15
. Calcitriol significantly increased the serum Ca x P product and aortic Ca content. Paricalcitol had no effect on serum Ca and Ca x P product, but the same dose of doxercalciferol significantly increased the Ca x P product and the aortic Ca content, which was confirmed by von Kossa staining. To determine if this increase in aortic Ca was due to the increase in Ca x P product or to a differential effect of the two VDR activators on vascular calcification, the study was repeated using a lower dose of doxercalciferol (0.10 μg/kg) and a higher dose of paricalcitol (0.24 μg/kg). A lower doxercalciferol dose did not increase the Ca x P product but increased the aortic Ca content. A higher dose of paricalcitol still had no effect. Therefore, different VDR activators have different effects on vascular calcification in uremic rats. The effects are independent of the serum Ca x P product, suggesting independent mechanisms a-OH-D μg/kg. Paricalcitol 0.16 μg/kg. 5. NC. UC. Calci- triol 0.04 μg/kg. 1α-OH-D μg/kg. Pari- calcitol 0.16 μg/kg. *The different effects of VDR activators on vascular calcification cannot be accounted for by differences in Ca x P product. NC, normal control; UC, uremic control. p< by analysis of variance; †p<0.01 vs UC; ‡p<0.01 vs paricalcitol by post hoc, Scheffe test. Mizobuchi M et al. Kidney Int 2007;72:709–15.")
45
VDR ενεργοποιητές και οστεοβλαστική δραστηριότητα
1.2 7 1.0 * ** 6 ** 0.8 * 5 Runx2 mRNA/GAPDH mRNA OC mRNA/GAPDH mRNA 0.6 8 4 3 0.4 2 0.2 1 0.0 Normal Control Calci- triol 0.04 μg/kg 1α-OH-D μg/kg Pari- calcitol μg/kg Normal Control Calci- triol 0.04 μg/kg 1α-OH-D μg/kg Pari- calcitol μg/kg Uremic Uremic

46
Έχουν θέση τα διφωσφονικά στην αντιμετώπιση των Α.Ε. ;
Σε κάποιες πειραματικές και κλινικές μελέτες έχει φανεί ότι: - Επιβραδύνουν την εξέλιξη των Α.Ε. - Εμποδίζουν τη δράση ενζύμων που ενέχονται στη βιοσύνθεση της χοληστερόλης - Μειώνουν την ικανότητα των μακροφάγων να αξιοποιούν την LDL στη διαδικασία αθηροσκλήρυνσης Χρειάζονται περισσότερες μελέτες ειδικά για ασθενείς με ΧΝΑ σοβαρού βαθμού

47
Κατακλείδα Πέραν του ελέγχου των επιπέδων Ρ και του Ca, τί στο μέλλον ; - ανασυνδυασμένο αντί- RANKL- αντιγόνο ; - ανασυνδυασμένη ΒΜΡ- 7 ; - ανασυνδυασμένη Fetuin- A ;

Παρόμοιες παρουσιάσεις


 είναι κυρίως νόσος των ηλικιωμένων. Η μέση ηλικία των ασθενών με ΚΑ είναι τα 75 έτη. Η μέση ηλικία.>")


