Κατέβασμα παρουσίασης
Η παρουσίαση φορτώνεται. Παρακαλείστε να περιμένετε

1
Ναυτιλιακή Οικονομική
Εισαγωγή Ναυτιλιακή Κύκλοι

2
Erling Naess – Norwegian Shipowner
“God must have been a ship owner. He placed the raw materials far from where they were needed and covered two thirds of the earth with water” Erling Naess – Norwegian Shipowner

3
The global sea transport demand model
Three categories of trade: There is deficit trade, which occurs when there is a physical shortage of a product in one area and a surplus in another. Competitive trade, a country may be capable of producing a product, but cheaper supplies are available overseas. Cyclical trade, which occurs in times of temporary shortages, for example due to poor harvest, or business cycles.

4
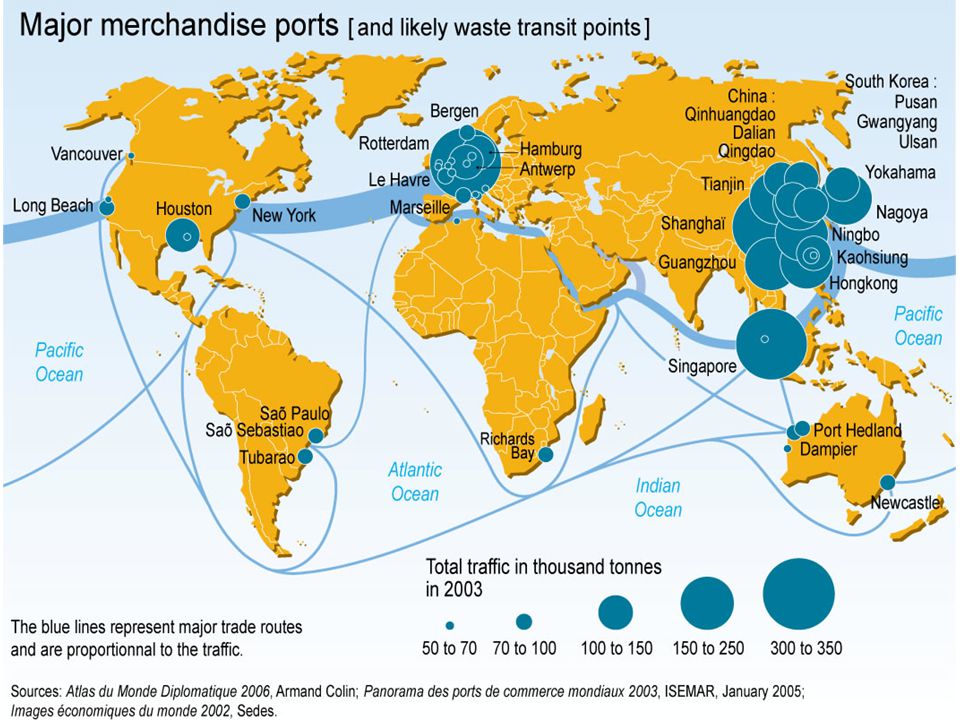
Shipping Routes

7
Parcel size distribution

8
Parcel size distribution

9
Vessel Sizes Dry Cargo Small Handy size, carriers of 20,000 long tons deadweight (DWT)-28,000 DWT Handy size, carriers of 28,000-40,000 DWT Seawaymax, the largest size that can traverse the St Lawrence Seaway Handymax, carriers of 40,000-50,000 DWT Panamax, the largest size that can traverse the Panama Canal (generally: vessels with a width smaller than 32.2 m) Capesize, vessels larger than Panamax and Post-Panamax, and must traverse the Cape of Good Hope and Cape Horn to travel between oceans Chinamax, carriers of 380, ,000 DWT with main dimensions limited by port infrastructure in China
 Capesize, vessels larger than Panamax and Post-Panamax, and must traverse the Cape of Good Hope and Cape Horn to travel between oceans. Chinamax, carriers of 380, ,000 DWT with main dimensions limited by port infrastructure in China.")
10
Vessel Sizes Wet Cargo Aframax, oil tankers between 75,000 and 115,000 DWT. This is the largest size defined by the average freight rate assessment (AFRA) scheme. Suezmax, the largest size that can traverse the Suez Canal from 116,000 dwt to 199,999 dwt. VLCC (Very Large Crude Carrier), supertankers between 150,000 and 320,000 DWT. Malaccamax, the largest size that can traverse the Strait of Malacca ULCC (Ultra Large Crude Carrier), enormous supertankers between 320,000 and 550,000 DWT
 scheme. Suezmax, the largest size that can traverse the Suez Canal from 116,000 dwt to 199,999 dwt. VLCC (Very Large Crude Carrier), supertankers between 150,000 and 320,000 DWT. Malaccamax, the largest size that can traverse the Strait of Malacca. ULCC (Ultra Large Crude Carrier), enormous supertankers between 320,000 and 550,000 DWT.")
11
The Shipping Cycle

12
Sir John Templeton (1999) The four most expensive words in the English language are “This time it’s different”
 The four most expensive words in the English language are This time it’s different")
13
Introducing the Shipping Cycle
Shipping cycles roll out like waves hitting a beach From a distance they look harmless, but once you are in the surf it’s a different story No sooner has one finished than another starts and, like surfers waiting for a wave, ship owners cluster in the trough, paddling to keep afloat and anxiously scanning the horizon for the next big roller.

14
The components of economic cycles
Cycles are not unique in shipping, they occur in other industries Economists analysed these cycles more deeply, and found that they often had several components which could be separated statistically using a technique known as ‘decomposition’. French economist Cournot stated: ‘it is necessary to recognize the secular variations which are independent of the periodic variations’.

15
The components of economic cycles

16
The components of economic cycles
Τhe first is the long –term cycle (or ‘Secular trend’) Is of importance if it is changing, and the big issue here is whether the underline cycle is moving upwards or downwards. The second is the short-term cycle (or business cycle) It is the one that corresponds more closely to most people’s notion of a shipping cycle. They fluctuate up and down, and a complete cycle can last anything from 3 to 12years from peak to peak. This is the form economic business cycles take and they are important drivers of the shipping market cycle.
 Is of importance if it is changing, and the big issue here is whether the underline cycle is moving upwards or downwards. The second is the short-term cycle (or business cycle) It is the one that corresponds more closely to most people’s notion of a shipping cycle. They fluctuate up and down, and a complete cycle can last anything from 3 to 12years from peak to peak. This is the form economic business cycles take and they are important drivers of the shipping market cycle.")
17
The components of economic cycles
Finally, there are seasonal cycles. These are regular fluctuations within the year. e.g In shipping the dry bulk market is often weak during July and August when relatively little grain is shipped.

18
Long shipping cycles ( the ‘Secular trend’)
These long-term cycles are driven by technical, economic or regional change. The long-cycle theory of the world economy was developed by the Russian economist, Nikolai Kondratieff Major western economies between 1790 and 1916, had experienced three periods of slow expansion and contraction of economic activity, averaging about fifty years in length. J.A . Schumpeter argued that the explanation of the long-wave cycles could be found in technological innovation. : was largely due to the dissemination of steam power : to the railway boom /16: to the joint effects of the motor car and electricity.

19
Short Cycles These data also provide information over the periodicity of cycles, by which they meant that they consisted of a sequence of phases, irrespective of duration. Overstone’s phases of the shipping cycle are the following: Market trough - YΦΕΣΗ (stage 1) Recovery - ΑΝΑΚΑΜΨΗ (stage2) Market peak - ΚΟΡΥΦΩΣΗ(stage 3) Collapse - ΚΑΤΑΡΡΕΥΣΗ(stage 4)
 Recovery - ΑΝΑΚΑΜΨΗ (stage2) Market peak - ΚΟΡΥΦΩΣΗ(stage 3) Collapse - ΚΑΤΑΡΡΕΥΣΗ(stage 4)")
20
Short Cycles

21
ΥΦΕΣΗ Υπάρχουν σημάδια πλεονάζουσας χωρητικότητας στις περιοχές φόρτωσης και χρησιμοποιήται οικονομική ταχύτητα πλεύσης το επίπεδο των ναύλων πέφτει στα όρια του λειτουργικού κόστους πιέζοντας έτσι μη οικονομικά πλοία στο παροπλισμό.

22
ΥΦΕΣΗ Η εκτεταμένη περίοδος ύφεσης δημιουργεί προβλήματα στη ομαλή χρηματοροή των ναυτιλακών εταιρείών και σε συνδιασμό με τη συνήθη επιφυλακτίκή ή και ανύπαρκτη χρηματοδότηση απο τις τράπεζες κατα τη περίοδο αυτή, πολλές εταιρείες αναγκάζονται να πωλήσουν πλοία στη σε τιμές ανάγκης, καθώς σε τέτοιες περιόδους δεν υπάρχει μεγάλη ζήτηση για αγορά μεταχειρισμένων πλοιών.

23
ΑΝΑΚΑΜΨΗ Ορίζεται ως η περίοδος όπου η ζήτηση και η προσφορά έρχονται σε κάποια ισορροπία και υπάρχουν οι πρώτες ενδείξεις ανάκαμψης των ναύλων πέραν των ορίων του λειτουργικού κόστους των πλοίων. Παραμένει όμως η αβεβαιότητα γιατί πολλές φορές ενώ υπήρχαν ενδείξεις η ανάκαμψη όμως δεν έλαβε χώρα. Καθώς η ρευστότητα ανακάμπτει οι τιμές των μεταχειρισμένων πλοίων ανακάμπτη μαζί με τη ψυχολογία της αγοράς.

24
ΚΟΡΥΦΩΣΗ η προσφορά ζήτησης έχει ήδη απορροφηθεί και η αγορά έρχεται σε μια φάση ισορροπίας. Οι ναύλοι είναι υψηλή αρκετές φορές μεγαλύτεροι από το λειτουργικό κόστος των πλοίων. . Σε αυτή τη χρονική περίοδο, δεν υφίστανται παροπλισμένα πλοία, η επιχειρησιακή ταχύτητα των πλοίων είναι η μέγιστη δυνατή.

25
ΚΟΡΥΦΩΣΗ Η ρευστότητα έχει επανέλθει στις ναυτιλιακές εταιρείες και οι τράπεζες επιθυμούν να χρηματοδοτήσουν νέες επενδύσεις στο κλάδο, κάτι που οδηγεί σε νέες παραγελίες πλοίων αλλά και σε ένα πλοιοδοτικό αγώνα για την απόκτηση μεταχειρισμένων πλοίων άμεσα διαθέσιμων για εκμετάλευση παράγοντας που οδηγεί πολλές φορές ωστε οι τιμές των μεταχειρισμένων να είναι υψηλότερες απο τις αντίστοιχες αξίες ναυπήγησης ενός αντίστοιχου μεγέθους πλοίου.

26
ΚΑΤΑΡΡΕΥΣΗ Όταν η προσφορά πλοίων ξεπερνά τη ζήτηση για μεταφορά φορτίων τότε η αγορά μπαίνει σε φάση κατάρρευσης, η οποία προκαλείται από θεμελιώδεις παράγοντες αλλά και απο την εισροή νεότευκτων πλοίων στη αγορά. Πλοία μένουν ανενεργά, οι ναύλοι καθώς και οι υπηρεσιακές ταχύτητες μειονωνται συνεχώς παράλληλα με την ρευστότητα των πλοιοκτητών, δημιουργόντας έτσι ψυχολογική πίεση στην αγορά αλλά και πανικό.

27
Shipping Cycles & Shipping Risk

28
Shipping Risk & Market Structure

29
Bulk Shipping Market Cycles,1945-2008

30
Oil Tanker Shipping Cycles

31
Prediction of Shipping Cycles
The problem is that although everyone knows about cycles, it is very different to believe in them. The fact that the cycles are never exactly the same just complicates matters. Investor willing to invest in this industry must be prepared to take some “shipping risk” One obvious strategy is to exploit the volatility of freight rates by taking positions based on the expected development of the cycle.

32
Prediction of Shipping Cycles
The strategy described by Alberton: Is to spot-charter on a rising market and when the peak is reached to sell or take a time charter long enough to carry the vessel through the trough. Ship acquisitions are made at the bottom of the market when ships are “cheap”. The skill lies in the execution of the mentioned strategy. Analysts have been caught out too often to believe they can forecast accurately.

33
Prediction of Shipping Cycles
Shipping cycles are not regular, they are a loose sequence of peaks and troughs. Since the timing of each stage in the cycle is irregular, simple rules like the seven years cycle, that are statistical correct, are too far unreliable in practice. The difficulty of analysing factors that affect the cycle is daunting. The world economy is complex and we obtain have to wait for years for the detail statistics to provide us with information of what exactly had happened.

34
Prediction of Shipping Cycles
Many of the variables and relationships in the model are highly unpredictable, so the prediction process should be seen as clarifying risk rather than creating certainty. Therefore , those playing the market must try to understand the cycles and take a risk, that is why they are paid for. An essential part of weighing up this risk is to form a realistic view of what is driving each stage in the cycle – reading the signs and when facts support it, being prepare to act.

35
The challenge of successful risk management
There are three conclusions to be drawn: For every winner there must be a loser. This aspect of the business is about risk management, not carrying cargo. Shipping cycles are not random. The economic and political forces which drives them, although highly complex, can be analysed. If everyone though have the same idea, no advantage will work. Each player must assess his opponents, take a view on how they play the game, and work out who will be the loser this time.

Παρόμοιες παρουσιάσεις


 Διδάσκων: Καθηγητής Χρήστος.>")


