Κατέβασμα παρουσίασης
Η παρουσίαση φορτώνεται. Παρακαλείστε να περιμένετε

1
http://www.inp.demokritos.gr/~vayaki/thermansi.htm Υπάρχει θέρμανση; Προβλέψεις του IPCC, τα GCM πρότυπα Δεδομένα και αξιοπιστία προτύπων Επιστημονικό συμπέρασμα Φυσικοί ρυθμοί: Ωκεάνιοι, ατμοσφαιρικοί, ηλιακοί Τα ακραία φαινόμενα και η θέρμανση Κλιμα και ακραία καιρικα φαινόμενα

2
AGW: Anthropogenic Global Warming Ανθρωπογενής Πλανητική Θέρμανση αλλοιώς: Υπερθέρμανση του Πλανήτη Climate Change Κληματική Αλλαγή Climate Disruption Κληματική Αποδιοργάνωση

3
είναι μία επιτροπή που διορίσθηκε από τον ΟΗΕ σε συνεργασία με τον διεθνή οργανισμό μετεωρολογίας για να μελετήσει τις αλλαγές κλίματος και να δημοσιεύσει τα συμπεράσματά, με σκοπό να ενημερωθούν οι πολιτείες για το αν χρειάζονται να ληφθούν μέτρα παγκοσμίως, και με ποίο τρόπο. Δημοσιεύθηκαν τέσσερες αναφορές, το 1992,1995,2001,2007,όπου το φαινόμενο του θερμοκηπίου κυριαρχεί. Η επόμενη αναμένεται τον Σεπτέμβριο του 2014. Οι “επιστήμονες” που ασχολήθηκαν με τις μελέτες αυτές και τις πολυσέλιδες αναφορές είναι περίπου 2000. Αυτή του 1995 οδήγησε στην συνθήκη του Κυότο, και αυτή του 2007 στην συγκέντρωση στο Μπαλί όπου επιχειρήθηκε να βρεθεί κοινός τόπος για μία νέα συμφωνία για την συγκράτηση των αερίων του θερμοκηπίου.Στην Κοπεγχάγη, Δεκέμβριο του 2009 δεν επετεύχθη συμφωνία όπως επιθυμούσαν πολλά από τα μέλη χώρες που συμμετείχαν. Μέχρι το 2014 θα υπάρξει το AR5. Στην προετοιμασία του γίνονται διάφορα συνέδρια, το 2011 έγινε στο Bordeaux της Γαλλίας. Φέτος στο Ρίο ντε Τζανέϊρο. Το IPCC, (Intergovernmental Panel on Climate Change )
.")
4
Καιρός και Κλίμα Ο καιρός είναι η πρόβλεψη για την επόμενη μέρα/εβδομάδα Το κλίμα είναι μία μέση τιμή του καιρού για μεγάλα χρονικά διαστήματα, κατά συνθήκη, 30 χρόνια Βασική μεταβλητή του καιρού είναι η θερμοκρασία, Τ, καθώς και για το κλίμα. Η μέση τιμή της θερμοκρασίας συνδέεται μεσω της Stefan-Boltzman εξίσωσης για το μέλαν σώμα με μονάδες ροής ενέργειας, Watts/m 2

5
Καιρός και Κλίμα 2 Στίς μελέτες για το κλίμα επιβάλλεται ισολογισμός μεταξύ της εισερχόμενης ηλιακής ενέργειας και της ακτινοβολούμενης από την γη προς το διάστημα. Forcings είναι στο λεξιλόγιο των κλιματολόγων, όχι των φυσικών, η επιπλέον ενεργειακή συνεισφορά από παράγοντες διάφορους που αλλάζουν το σημείο ισορροπίας σε μιά ιδεατή σφαίρα ανάμεσα στην Τροπόσφαιρα και την Στρατόσφαιρα όπου εξισορροπεί η εισερχόμενη με την εξερχόμενη ενέργεια, ώστε να μη υπερθερμανθεί ο πλανήτης (ήλιος, σύννεφα, αέρια θερμοκηπίου) Η θερμοκρασία είναι η κύρια μεταβλητή που αναλύεται διεξοδικά στις μελέτες του IPCC με προσαρμογή των προτύπων στα δεδομενα.
 Η θερμοκρασία είναι η κύρια μεταβλητή που αναλύεται διεξοδικά στις μελέτες του IPCC με προσαρμογή των προτύπων στα δεδομενα..")
6
Albedo H2O CO2 + 15C 390Watts/m^2 5C 338 ’’’’’ σ = 5.67×10⁻⁸ W m−2 K−4 Energy budget Ξηρά ατμοσφ. N2 78.084% O2 20.946% Ar 0.934% Λοιπα 0.03768% Η2Ο~0.40% Ολικά στην επιφάνεια 1%-4% 1,366 watts /m**2, μέσος όρος ολοκληρώνοντας τη γη και για ένα χρόνο

7
θερμοκρασία Πως μετριέται η θερμοκρασία; Θερμόμετρα από τον 19ο αιώνα Proxy : ενδιάμεσος Πυρήνες απο παγετώνες Ανάπτυξη δέντρων Κατακαθήσεις διαφόρων οργανικών Κ.λ.π. Δορυφόροι μετα το 1979

8
Amsu 7.5km

9
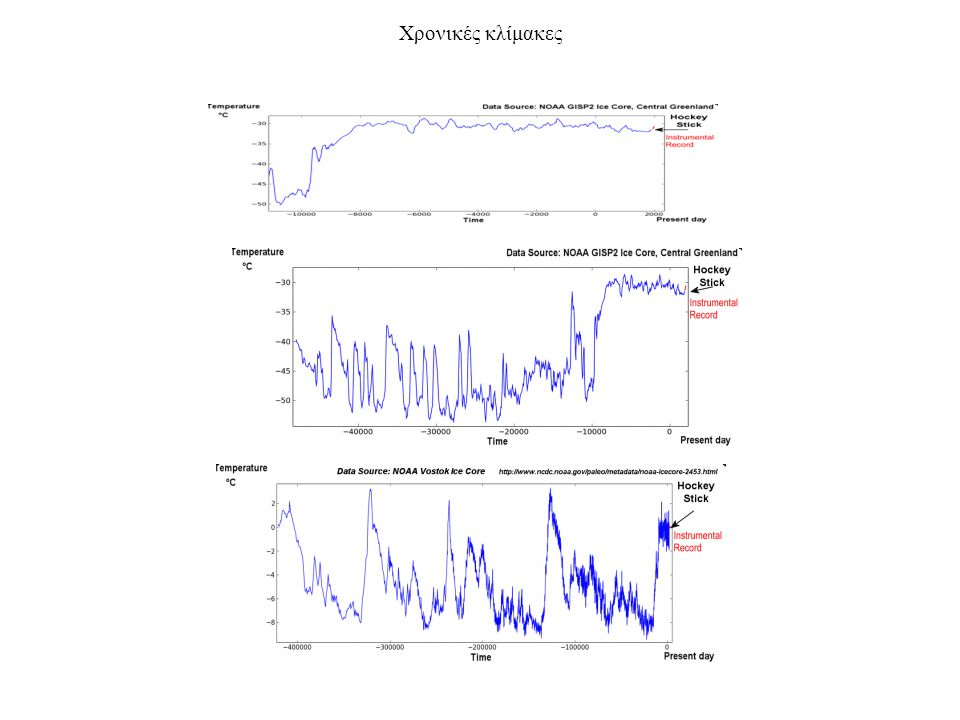
Ας δούμε τι λένε τα δεδομένα απο τους πυρήνες των πάγωνπυρήνες των πάγων Υπάρχουν πολλές μετρήσεις παλαιοντολογικών θερμοκρασιών με διάφορες μεθόδους. Αυτή των πάγων βασίζεται στην μέτρηση λόγων ισοτόπων σε στρωματοποιημένα δείγματα πάγων. Τα παγιδευμένα αέρια δίνουν πληροφορίες και για τις ποσότητες CO2 και του Ο2. O λόγος των ισοτόπων του οξυγόνου δίνει την θερμοκρασία. Η χρονολογία έρχεται από το βάθος του στρώματος Υπάρχει Θέρμανση; Ναι.

10
hockey

11
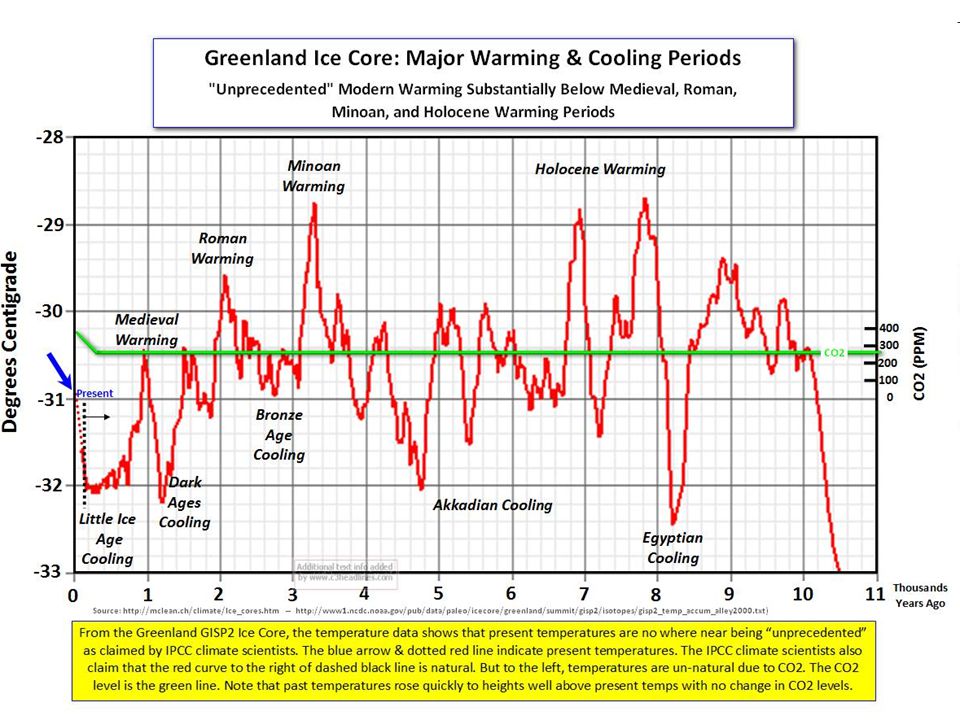
Χρονικές κλίμακες

14
the 400 years following each minimum in the record that leads to a sustained sharp rise There were 10 of them; the first five are plotted in cyan and the more recent 5 in blue. The hatched black line is the average of the 5 recent (blue) spikes. The red dots are the uptick at the end of GISP2 and HadSST, spliced at 1850. http://wattsupwiththat.com/2011/07/01/whats-up-next/#more-42538
 spikes. The red dots are the uptick at the end of GISP2 and HadSST, spliced at")
15
General Circulation Models Επιβάλλουν τις εξισώσεις που υποθέτουν ότι ισχύουν για τις αλλαγές στον χρόνο των μεταβλητών, και βήμα βήμα προσαρμόζουν τις παραμέτρους ώστε να συνταιριάξουν τούς υπολογισμούς με τα δεδομένα. Όταν εκτιμηθεί ότι έχει συγκλίνει η λύση, σταθεροποιούν τις παραμέτρους και προχωρούν τον υπολογισμό στον μελλοντικό χρόνο, κάνοντας «πρόβλεψη» καιρού. Τα πολυάριθμα πρότυπα του IPCC είναι τού ιδίου τύπου, μόνο που οι προσαρμογές εστιάζονται στην αλλαγή θερμοκρασίας και η πρόβλεψη επεκτείνεται στα εκατό χρόνια και λέγεται “προβολή κλίματος”. Τα GCM του κλίματος έχουν εκ κατασκευής την συνεισφορά του διοξειδίου του άνθρακα ως βασική δομική υπόθεση. Μέθοδος υπολογισμών

16
grid

17
GCMs or General Circulation Models, weather turned into climate models by increasing grids and approximations. Typical 200kmX200kmX20km, 20 minute steps.

18
Πλήθος Παραμέτρων Προσαρμόζονται στα δεδομένα Προεκτείνονται στο μέλλον Γραμμική υπόθεση:y=a+bx Αναπόφευκτη η αποτυχία στην προέκταση στο μέλλον γιατί η αεροδυναμική, υδροδυναμική κλπ περιγράφονται απο συζευγμένες διαφορικές εξισώσεις με δεδομένη την μή γραμμικότητα χρόνος

19
CO2 και πρότυπα Στους υπολογισμούς στα πρότυπα αυτά πρωταγωνιστικό ρόλο παίζει η περιεκτικότητα σε CO2. Οι υποθέσεις για τις διάφορες συνεισφορές οδηγούν και σε παρατηρήσιμα φαινόμενα που προβλέπουν τα πρότυπα, τα οποία το ίδιο το IPCC θεωρεί ως “δακτυλικά αποτυπώματα”. Η κύρια μεταβλητη είναι η «ανωμαλία» της μέσης θερμοκρασίας στον πλανήτη. Η διαφορά της μέσης τιμής της από κάποια αρχική. Πρέπει να τονιστεί ότι τα πρότυπα αυτά είναι απλοποιημένα, βασικά διότι χρειάζονται πολύ υπολογιστικό χρόνο σε μεγάλους υπολογιστές ακόμα και μετά την απλοποίηση των δυναμικών εξισώσεων που υπεισέρχονται στο πρόβλημα.

20
Φαινόμενο “θερμοκηπίου”

21
Green house gases

22
Πώς μπορεί να αποκτήσει το ανθρωπογενές CO2 τόσο μεγάλο ρόλο στήν μόνωση/θέρμανση του πλανήτη όταν είναι μόνο το 0.3% των φυσικών αερίων θερμοκηπίου; Με ένα εξειδικευμένο πρότυπο ανατροφοδότησης (feedback). Αυξάνει το ανθρωπογενές CO2 κατα x% ; αυξάνει η θερμοκρασία στους ωκεανούς, που αποδίδουν H2O και CO2, οι υδρατμοί δημιουργούν σύννεφα και συγκρατούν περαιτέρω την θερμοκρασία, και γίνεται μία καταιγιστική ανατροφοδότηση. Αυτά έχουν προγραμματιστεί, και έτσι δίνονται οι προβλέψεις καταστροφής από την αύξηση του CO2.. Ανθρωπογενές CO2

23
policy

24
Τελευταίες μετρήσεις “ανωμαλιών” x X

25
Table 2 from the paper. Some estimates of climate sensitivity published 2004–2012. Values are in units C, for a doubling of pCO2. Where published values are in units C/(Wm−2), the published value is multiplied by 3.7 for the purpose of this comparison. Note that Asten’s median value of 1.1 agrees with Douglas and Christy. http://www.clim-past-discuss.net/8/4923/2012/cpd-8-4923-2012.pdf http://www.clim-past-discuss.net/8/4923/2012/cpd-8-4923-2012.pdf
, the published value is multiplied by 3.7 for the purpose of this comparison. Note that Asten’s median value of 1.1 agrees with Douglas and Christy.")
26
Τελευταίες μετρήσεις 2012, http://www.drroyspencer.com/latest-global-temperatures

27
Μέσες ετήσιες θερμοκρασίες

28
Η σκούρα γραμμή είναι δεδομένα GISS σε αντίθεση με τις “ανωμαλίες” της θερμοκρασίας, τα πρότυπα αποτυγχάνουν Στην αναπαραγωγή των δεδομένων θερμοκρασίας.

29
CO2 since 1960

30
Κακός συσχετισμός CO2 με θερμοκρασία

31
Παραγωγή αερίου απο shale ελαττωνει το CO2 στις ΗΠΑ

32
Η Κίνα όμως ακάθεκτη http://www.eia.gov/countries/img/charts_png/CH_co2con_img.png

33
Κακός συσχετισμός CO2 με θερμοκρασία

34
τροπόσφαιρα

35
Τα δεδομένα απο τους δορυφόρους

36
Ανατροφοδότηση

37
Ειδική υγρασία

38
Ωκεάνια κατακράτηση θέρμανση Κόκκινο δεδομένα. Πράσινο πρότυπα

39
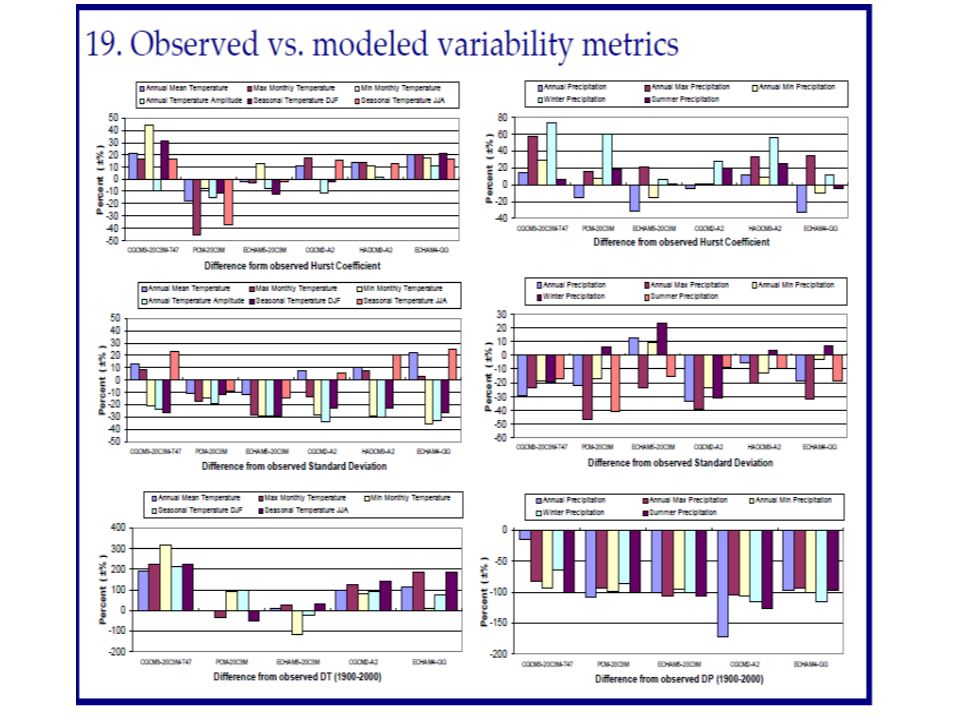
Καθ.Δ.Κουτσογιάννης et al http://www.itia.ntua.gr/ http://www.itia.ntua.gr/ Η ομάδα του κ. Κουτσογιάννη στο Εθνικο Μετσοβειο Πολυτεχενειοέχει κάνει συστηματική δουλειά μελετώντας τα αποτελέσματα των IPCC προτύπων σε υδρολογικά δεδομένα στον χρόνο και στον πλανήτη και καταλήγει στο συμπερασμα μεταξυ άλλων However, model outputs at annual and climatic (30 year) scales are irrelevant with reality; also, they do not reproduce the natural overyear fluctuation and, generally, underestimate the variance and the Hurst coefficient of the observed series; none of the models proves to be systematically better than the others. The huge negative values of coefficients of efficiency at those scales show that model predictions are much poorer that an elementary prediction based on the time average. This makes future climate projections not credible.
 scales are irrelevant with reality; also, they do not reproduce the natural overyear fluctuation and, generally, underestimate the variance and the Hurst coefficient of the observed series; none of the models proves to be systematically better than the others. The huge negative values of coefficients of efficiency at those scales show that model predictions are much poorer that an elementary prediction based on the time average. This makes future climate projections not credible..")
41
http://itia.ntua.gr/getfile/978/1/documents/928051726__.pdf The performance of the models at local scale at 55 stations worldwide (in addition to the 8 stations used in Koutsoyiannis et al., 2008) is poor regarding all statistical indicators at the seasonal, annual and climatic time scales. In most cases the observed variability metrics (standard deviation and Hurst coefficient) are underestimated. The performance of the models (both the TAR and AR4 ones) at a large spatial scale, i.e. the contiguous USA, is even worse. None of the examined models reproduces the over ‐ year fluctuations of the areal temperature of USA (gradual increase before 1940, falling trend until the early 1970’s, slight upward trend thereafter); most overestimate the annual mean (by up to 4°C) and predict a rise more intense than reality during the later 20th century. On the climatic scale, the model whose results for temperature are closest to reality (PCM ‐ 20C3M) has an efficiency of 0.05, virtually equivalent to an elementary prediction based on the historical mean; its predictive capacity against other indicators (e.g. maximum and minimum monthly temperature) is worse. The predictive capacity of GCMs against the areal precipitation is even poorer (overestimation by about 100 to 300 mm). All efficiency values at all time scales are strongly negative, while correlations vary from negative to slightly positive. Contrary to the common practice of climate modellers and IPCC, here comparisons are made in terms of actual values and not departures from means (“anomalies”). The enormous differences from reality (up to 6°C in minimum temperature and 300 mm in annual precipitation) would have been concealed if departures from mean had been taken. http://www.itia.ntua.gr/getfile/900/2/documents/2009EGU_ClimatePr.pdf http://itia.ntua.gr/en/docinfo/1001 /
 are underestimated. The performance of the models (both the TAR and AR4 ones) at a large spatial scale, i.e. the contiguous USA, is even worse. None of the examined models reproduces the over ‐ year fluctuations of the areal temperature of USA (gradual increase before 1940, falling trend until the early 1970’s, slight upward trend thereafter); most overestimate the annual mean (by up to 4°C) and predict a rise more intense than reality during the later 20th century. On the climatic scale, the model whose results for temperature are closest to reality (PCM ‐ 20C3M) has an efficiency of 0.05, virtually equivalent to an elementary prediction based on the historical mean; its predictive capacity against other indicators (e.g. maximum and minimum monthly temperature) is worse. The predictive capacity of GCMs against the areal precipitation is even poorer (overestimation by about 100 to 300 mm). All efficiency values at all time scales are strongly negative, while correlations vary from negative to slightly positive. Contrary to the common practice of climate modellers and IPCC, here comparisons are made in terms of actual values and not departures from means ( anomalies ). The enormous differences from reality (up to 6°C in minimum temperature and 300 mm in annual precipitation) would have been concealed if departures from mean had been taken. /.")
42
Η θερμοκρασία είναι στάσιμη τα τελευταία δέκα χρόνια και ίσως πέφτει ενώ το CO2 αυξάνει Δεν υπάρχει το CO2 αποτύπωμα στην θερμοκρασία της τροπόσφαιρας Δεν υπάρχει θετική ανατροφοδότηση Η ειδική υγρασία ελαττώνεται αντί να αυξάνει Η ενέργεια που λείπει δεν κρύβεται στους ωκεανούς. Τα πρότυπα δεν αναπαράγουν τις απολυτες θερμοκρασίες Οι υδρολογικές προβλέψεις των προτύπων αστοχούν Μία υπόθεση καταρρίπτεται αν και μία μόνο από τις πρόβλεψεις της δεν επιβεβαιώνεται, και εδώ έχουμε επτά. Συμπερασματικά τα IPCC πρότυπα διαψεύδονται από:

43
Γιατί; αναμενόμενο; πυρήνες των πάγων

44
Πριν 500 εκατομύρια χρόνια

45
Τονίζουμε οτι το CO2 έπεται της αύξησης της θερμοκρασίας κατα 800+/- 200 χρόνια. Αυτό οφείλεται στο ότι οι κρύοι ωκεανοί δεσμεύουν το CO2, και το αποδίδουν στην ατμόσφαιρα όσο θερμαίνονται. Εάν υπήρχε ατμοσφαιρικός μηχανισμός όπου μία μικρή αλλαγή στο CO2 θα οδηγούσε καταιγιστικά στην αύξηση θερμοκρασίας, οι δύο καμπύλες θα γινόντουσαν σύγχρονες αμέσως ( μέσα στις ακρίβειες των ως άνω δεδομένων). Γιατί η μικρή άυξηση του ποσοστού του CO2 να γίνει αισθητή μέσα στα σφάλματα, όπως υποθέτουν τα πρότυπα GCM ; CO2 Mauna Loa CO2
. Γιατί η μικρή άυξηση του ποσοστού του CO2 να γίνει αισθητή μέσα στα σφάλματα, όπως υποθέτουν τα πρότυπα GCM ; CO2 Mauna Loa CO2.")
46
Ηλιακά πρότυπα Ωκεάνια ρεύματα Κοσμικές ακτίνες Κλπ Χαοτικά Εναλλακτικές προτάσεις

47
Καιρός και κλίμα, επανεξέταση: Contrary to [Bryson, 1997], we have argued that the climate is not accurately viewed as the statistics of fundamentally fast weather dynamics that are constrained by quasi fixed boundary conditions. The empirically substantiated picture is rather one of unstable (high frequency) weather processes tending – at scales beyond 10 days or so and primarily due to the quenching of spatial degrees of freedom – to quasi stable (intermediate frequency, low variability) macroweather processes. Climate processes only emerge from macroweather at even lower frequencies, and this thanks to new slow internal climate processes coupled with external forcings. Their synergy yields fluctuations that on average again grow with scale and become dominant typically on time scales of 10 – 30 years up to ≈ 100 kyrs. Looked at another way, if the climate really was what you expected, then – since one expects averages – predicting the climate would be a relatively simple matter. On the contrary, we have argued that from the stochastic point of view – and notwithstanding the vastly different time scales – that predicting natural climate change is very much like predicting the weather. This is because the climate at any time or place is the consequence of climate changes that are (qualitatively and quantitatively) unexpected in very much the same way that the weather is unexpected. http://www.physics.mcgill.ca/~gang/eprints/eprintLovejoy/esubmissions/climate.not.26.6.12.pdf
![Καιρός και κλίμα, επανεξέταση: Contrary to [Bryson, 1997], we have argued that the climate is not accurately viewed as the statistics of fundamentally fast weather dynamics that are constrained by quasi fixed boundary conditions.](http://images.slideplayer.gr/10/2788926/slides/slide_47.jpg "The empirically substantiated picture is rather one of unstable (high frequency) weather processes tending – at scales beyond 10 days or so and primarily due to the quenching of spatial degrees of freedom – to quasi stable (intermediate frequency, low variability) macroweather processes. Climate processes only emerge from macroweather at even lower frequencies, and this thanks to new slow internal climate processes coupled with external forcings. Their synergy yields fluctuations that on average again grow with scale and become dominant typically on time scales of 10 – 30 years up to ≈ 100 kyrs. Looked at another way, if the climate really was what you expected, then – since one expects averages – predicting the climate would be a relatively simple matter. On the contrary, we have argued that from the stochastic point of view – and notwithstanding the vastly different time scales – that predicting natural climate change is very much like predicting the weather. This is because the climate at any time or place is the consequence of climate changes that are (qualitatively and quantitatively) unexpected in very much the same way that the weather is unexpected.")
48
Ηλιακά, ωκεάνια κ.λ.π. Οι γαλακτικές κοσμικές ακτίνες ακολουθούν τον ηλιακό κύκλο

49
Ηλιακός κύκλος

50
http://solarscience.msfc.nasa.gov/predict.shtml

51
Ο ηλιακός κύκλος Latitude-time plots of jet streams under the Sun's surface show the surprising shutdown of the solar cycle mechanism. New jet streams typically form at about 50 degrees latitude (as in 1999 on this plot) and are associated with the following solar cycle 11 years later. New jet streams associated with a future 2018-2020 solar maximum were expected to form by 2008 but are not present even now, indicating a delayed or missing Cycle 25.
 and are associated with the following solar cycle 11 years later. New jet streams associated with a future solar maximum were expected to form by 2008 but are not present even now, indicating a delayed or missing Cycle 25..")
52
Συσχετιση με μηκος προηγούμενου κύκλου Friis-Christenson and Lassen

53
Κύκλος 24

54
Armagh, Ireland

55
El Nino Southern Oscillation Pacific Decadal Oscillation

56
Cell structure of circulation http://commons.wikimedia.org/wiki/File:Earth_Global_Circulation.jpg

57
Image: La Niña is characterized by unusually cold ocean temperatures in the central equatorial Pacific. The colder than normal water is depicted in this image in blue. During a La Niña stronger than normal trade winds bring cold water up to the surface of the ocean. Credit: NASA

58
Αρκτική ταλάντωση,Arctic Oscillation, a pressure index

59
Χάος Ο καθηγητής του Wisconcin U., Α. Τσώνης και οι συνεργάτες του ανέπτυξαν ένα χαοτικό πρότυπο βασισμένο στα ωκεάνια και ατμοσφαιρικά ρεύματα. Προβλέπουν ψύξη τις επόμενες δεκαετίες. ΄Ενα φυσικό σύστημα που διέπεται από συζευγμένες διαφορικές εξισώσεις υπακούει στα μαθηματικά του προσδιοριστικού χάους. ( Deterministic chaos). Το σύστημα ατμόσφαιρας, ωκεανών, στερεάς είναι κατ΄εξοχήν ένα χαοτικό συστημα Ας δούμε Ας δούμε ένα πολύ απλό σύστημα συζευγμένων διαφορικών εξισώσεων που στα μετρήσιμα μεγέθη είναι χαοτικό. http://www.youtube.com/watch?v=QXf95_EKS6E&feature=fvwrel
. Το σύστημα ατμόσφαιρας, ωκεανών, στερεάς είναι κατ΄εξοχήν ένα χαοτικό συστημα Ας δούμε Ας δούμε ένα πολύ απλό σύστημα συζευγμένων διαφορικών εξισώσεων που στα μετρήσιμα μεγέθη είναι χαοτικό. v=QXf95_EKS6E&feature=fvwrel.")
60
Tsonis et al

61
Τόν τελευταίο καιρό ακούμε για ακραία καιρικά φαινόμενα. http://www.guardian.co.uk/environment/2012/jul/10/extreme-weather- manmade-climate-change The findings make it much more likely that we will soon – within the next few years – be able to discern whether the extremely wet and cold summer and spring so far experienced in the UK this year are attributable to human causes rather than luck, according to the researchers. http://www.guardian.co.uk/uk/2012/jul/08/summer-unending-rainextremely wet and cold summer and spring so far experienced in the UK http://www.guardian.co.uk/uk/2012/jul/08/summer-unending-rain Freak storms, flash floods, record rain – and there's more to come

63
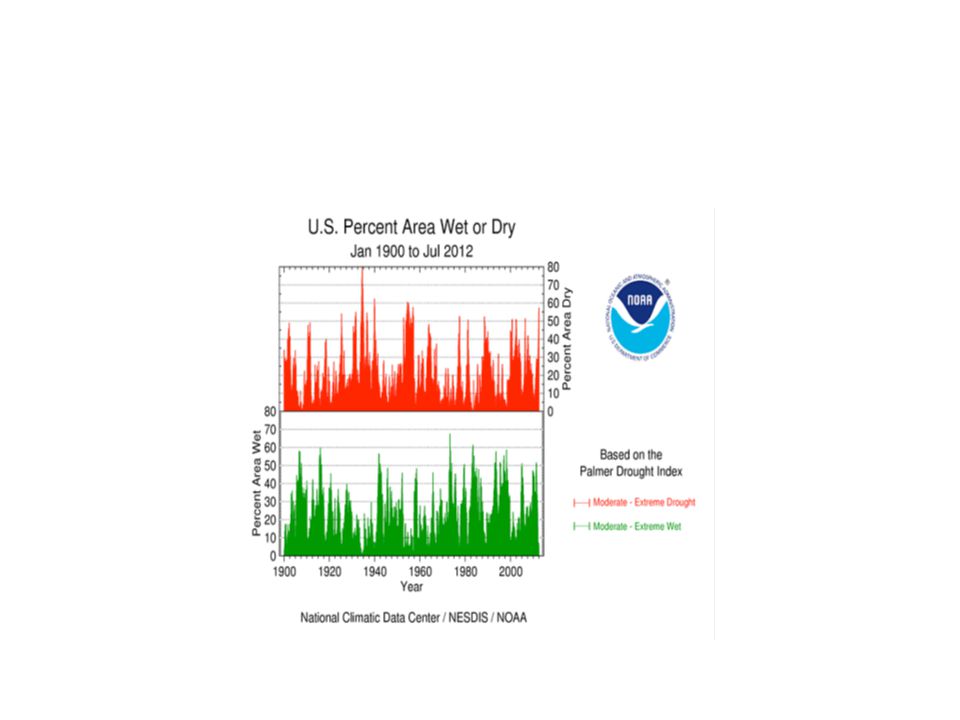
Είναι αλήθεια ότι τα ακραία καιρικά φαινόμενα έχουν αυξηθεί? Αν ναι, είναι αποδεδειγμένα υπεύθυνη η μικρή αύξηση της θερμοκρασίας Για μιά φορά ακόμα Συσχέτιση δεν σημαίνει και σχέση αιτίας αιτιατού (correlation is not causation).
..")
64
Frequency of correlation to causation

65
Στο παρα κάτω link υπάρχει εμπεριστατωμένη παρουσίαση του καθ. John R. Christy, Alabama State Climatologist προς το House Energy and Power Subcommittee των ΗΠΑ όπου καταλήγει ότι τα ακραία φαινόμενα στις ΗΠΑ δεν μπορουν να αποδοθούν στην αύξηση της θερμοκρασίας και οπωσδήποτε όχι στην αύξηση του CO2 http://energycommerce.house.gov/sites/republicans.energycommerce.hous e.gov/files/Hearings/EP/20120920/HHRG-112-IF03-WState-ChristyJ- 20120920.pdf

67
Σε μερικά φαινόμενα υπάρχει χρονικός συσχετισμός με την μικρή άνοδο της θερμοκρασίας. Σε άλλα όχι. Σε κάθε περίπτωση τα κλιματικά πρότυπα δεν είναι σε θέση να δώσουν προβλέψεις για αυτές τις κυρίως χαοτικές εκφάνσεις του κλίματος. http://www.nature.com/news/extreme-weather-1.11428 http://www.nature.com/news/extreme-weather-1.11428 Nature | Editorial Extreme weather Better models are needed before exceptional events can be reliably linked to global warming. 19 September 2012 As climate change proceeds — which the record summer melt of Arctic sea-ice suggests it is doing at a worrying pace — nations, communities and individual citizens may begin to seek compensation for losses and damage arising from global warming. Climate scientists should be prepared for their skills one day to be probed in court. Whether there is a legal basis for such claims, such as that brought against the energy company ExxonMobil by the remote Alaskan community of Kivalina, which is facing coastal erosion and flooding as the sea ice retreats, is far from certain, however. So lawyers, insurers and climate negotiators are watching with interest the emerging ability, arising from improvements in climate models, to calculate how anthropogenic global warming will change, or has changed, the probability and magnitude of extreme weather and other climate-related events. But to make this emerging science of ‘climate attribution’ fit to inform legal and societal decisions will require enormous research effort.

68
http://wattsupwiththat.com/2012/10/01/dr-ryan-maue-releases-new-hurricane-frequency-data-showing-a- negative-trend-in-the-last-30-years/#more-71773

69
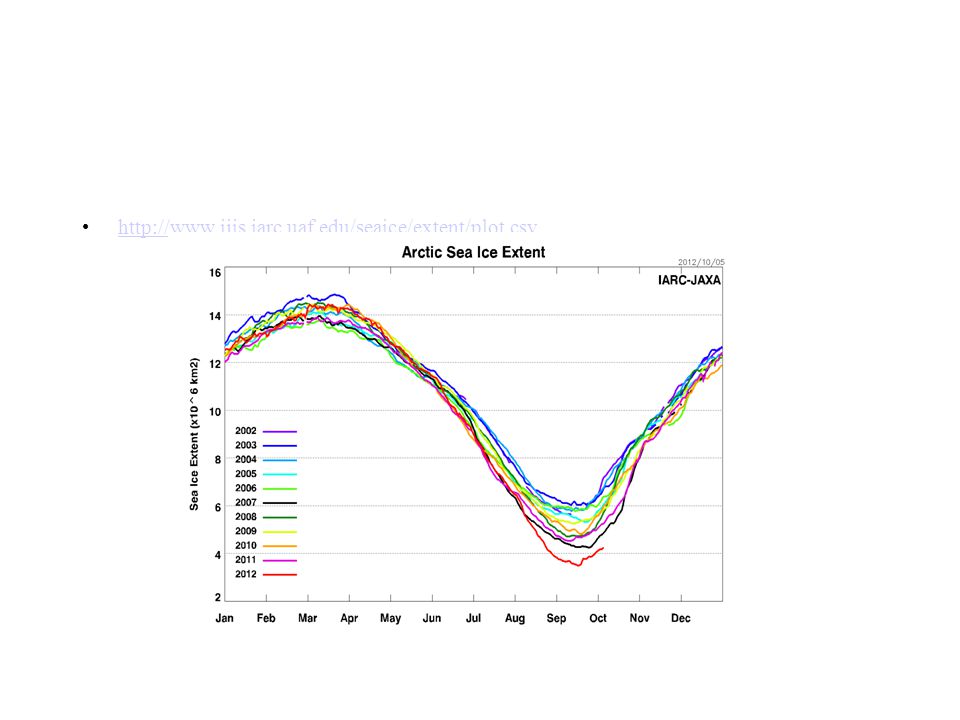
http://www.ijis.iarc.uaf.edu/seaice/extent/plot.csv
70
http://nsidc.org/ data/seaice_index /images/ daily_images /S_timeseries.png

71
Τι δεν περιλαμβάνεται στις δυναμικές παραδοχές των προτύπων αυτών 1. Earth’s Rotational Energy; http://en.wikipedia.org/wiki/Rotational_energy http://en.wikipedia.org/wiki/Earth%27s_rotation http://www.physicalgeography.net/fundamentals/6h.html http://en.wikipedia.org/wiki/Rotational_energy http://en.wikipedia.org/wiki/Earth%27s_rotation http://www.physicalgeography.net/fundamentals/6h.html results in day and night; http://wiki.answers.com/Q/Why_does_rotation_cause_day_and_night http://wiki.answers.com/Q/Why_does_rotation_cause_day_and_night causes the Coriolis Effect; http://en.wikipedia.org/wiki/Coriolis_effect http://en.wikipedia.org/wiki/Coriolis_effect imparts Planetary Vorticity on the oceans; http://oceanworld.tamu.edu/resources/ocng_textbook/chapter12/chapter12_01.htm http://oceanworld.tamu.edu/resources/ocng_textbook/chapter12/chapter12_01.htm and manifests as Ocean Gyres; http://en.wikipedia.org/wiki/Ocean_gyre http://en.wikipedia.org/wiki/Ocean_gyre the Antarctic Circumpolar Current; http://en.wikipedia.org/wiki/Antarctic_Circumpolar_Current http://en.wikipedia.org/wiki/File:Conveyor_belt.svg http://en.wikipedia.org/wiki/Antarctic_Circumpolar_Current http://en.wikipedia.org/wiki/File:Conveyor_belt.svg and Arctic Ocean circulation: http://www.whoi.edu/page.do?pid=12455&tid=441&cid=47170&ct=61&article=20727 http://www.john-daly.com/polar/flows.jpg http://www.whoi.edu/page.do?pid=12455&tid=441&cid=47170&ct=61&article=20727 http://www.john-daly.com/polar/flows.jpg Earth’s Rotational Energy influences Atmospheric Circulation; http://en.wikipedia.org/wiki/Atmospheric_circulation http://en.wikipedia.org/wiki/Atmospheric_circulation including the Jet Stream; http://en.wikipedia.org/wiki/Jet_stream http://en.wikipedia.org/wiki/Jet_stream Westerlies; http://en.wikipedia.org/wiki/Westerlies http://en.wikipedia.org/wiki/Westerlies Tradewinds; http://en.wikipedia.org/wiki/Trade_wind http://en.wikipedia.org/wiki/Trade_wind Tropical Cyclones; http://en.wikipedia.org/wiki/Tropical_cyclone http://en.wikipedia.org/wiki/Tropical_cyclone Tornadoes: http://en.wikipedia.org/wiki/Tornado http://en.wikipedia.org/wiki/Tornado and Polar Vortices; http://en.wikipedia.org/wiki/Polar_vortex http://en.wikipedia.org/wiki/Polar_vortex which “are caused when an area of low pressure sits at the rotation pole of a planet. This causes air to spiral down from higher in the atmosphere, like water going down a drain.” http://www.universetoday.com/973/what-venus-and-saturn-have-in-common/ http://www.universetoday.com/973/what-venus-and-saturn-have-in-common/ http://wattsupwiththat.com/2011/06/30/earths-climate-system-is-ridiculously-complex-with-draft-link-tutorial/

72
Details that could throw doubt on your interpretation must be given, if you know them. You must do the best you can–if you know anything at all wrong, or possibly wrong–to explain it. If you make a theory, for example, and advertise it, or put it out, then you must also put down all the facts that disagree with it, as well as those that agree with it. There is also a more subtle problem. When you have put a lot of ideas together to make an elaborate theory, you want to make sure, when explaining what it fits, that those things it fits are not just the things that gave you the idea for the theory; but that the finished theory makes something else come out right, in addition. From the book “Surely You're Joking, Mr. Feynman

Παρόμοιες παρουσιάσεις


, Performance Indicators (PIs), Key Performance Indicators (KPIs)>")


 ωφελέειν ή μη βλάπτειν ωφελέειν = θεραπευτική παρέμβαση μη βλάπτειν = ασφάλεια ασθενών.>")
 Όραση Μαρία Κουτρομάνου. Structure of the Eye: Iris The iris is similar to the diaphragm in a camera Your iris widens in dim light and.>")