Κατέβασμα παρουσίασης
Η παρουσίαση φορτώνεται. Παρακαλείστε να περιμένετε

1
Renewable Energy Sources in Greece, within the crisis environment 4rth InnoForum, Athens Information Technology, 25 May 2012

2
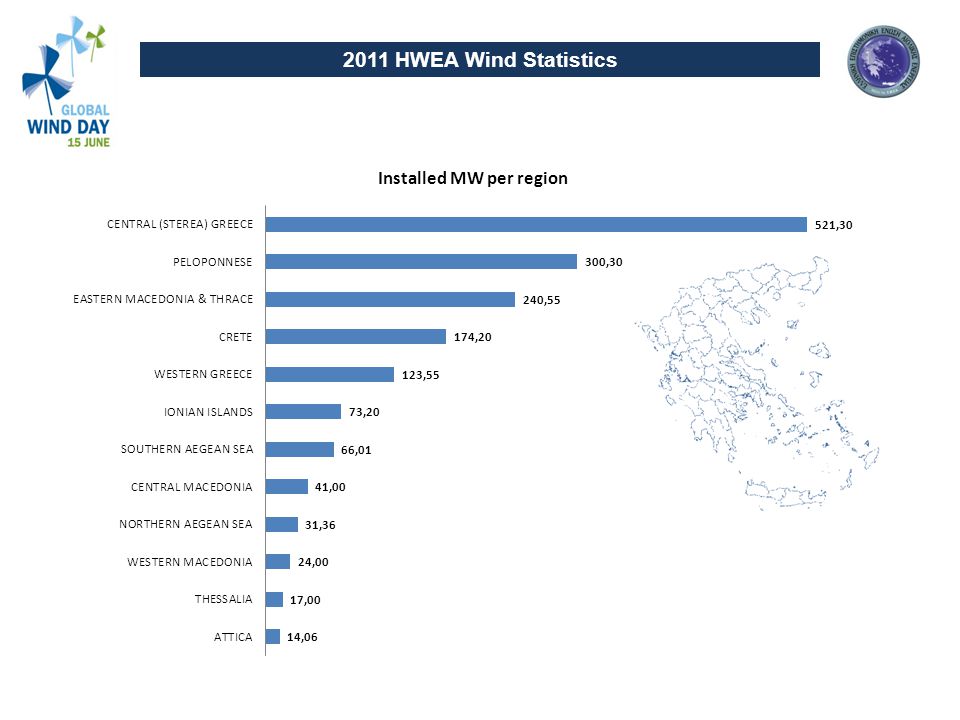
The HWEA Wind Statistics take into account the wind capacity which are in commercial or test operation in Greece and it is based on sources from the market actors. 2011 HWEA Wind Statistics

6
Total new capacity installed in 2010: 166,75 MW Total new capacity installed in 2011 : 311,20 MW

7
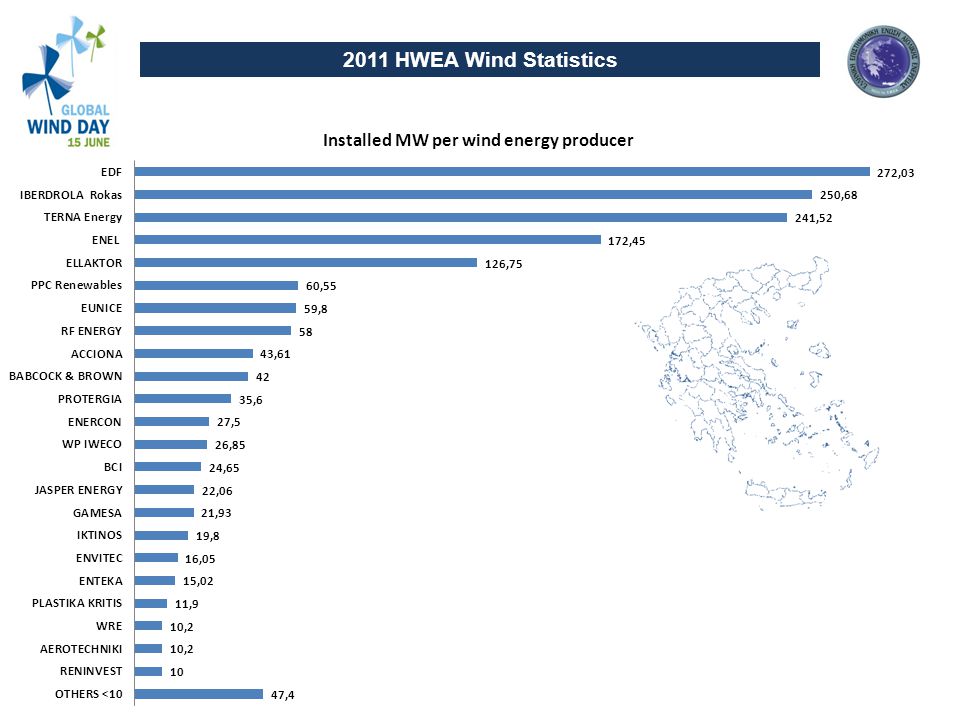
2011 HWEA Wind Statistics

8
PV Statistics 2011 - HELAPCO

9
RES Statistics 2011 – Ministry EECC Installed Capacity 2011 (MW)
")
10
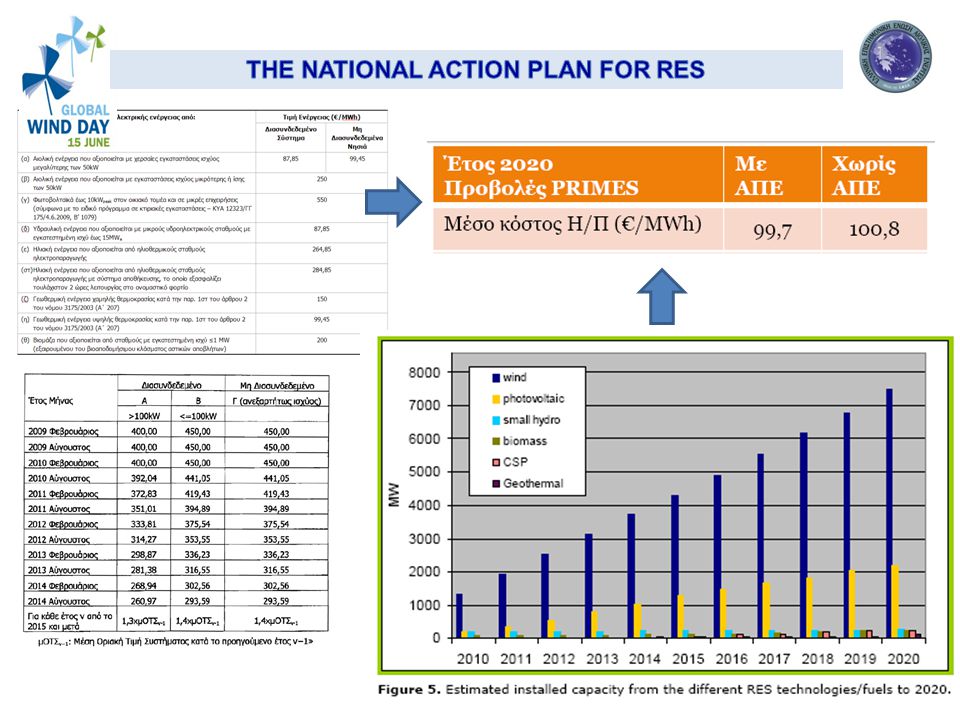
Πηγή: Εργαστήριο Ενέργειας Οικονομίας Περιβάλλοντος ΕΜΠ, http://www.eletaen.gr/drupal/sites/default/files/meleti_emp.pdf Without RES, the cost of capital is reduced. However the fuel cost and the CO 2 payments are increased. The latter increase is bigger from the cost of capital reduction even for a relative low CO 2 price (20 €/tn )
.")
11
Πηγή: ΕC Working documents SEC 2008(57) 23.1.2008 http://ec.europa.eu/energy/climate_actions/doc/2008_res_working_document_en.pdf
")
12
Πηγή: Wind Energy and Electricity Prices, POYRY – EWEA, April 2010 http://www.eletaen.gr/drupal/sites/default/files/ewea/MeritOrder.pdf

13
Πηγή: Εργαστήριο Ενέργειας Οικονομίας Περιβάλλοντος ΕΜΠ, http://www.eletaen.gr/drupal/sites/default/files/meleti_emp.pdf •RES reduce the wholesale price (System Marginal Price – 9.5 € / ΜWh according to Primes simulation for 2011) and thus they reduce the suppliers cost •RES contribute capacity in the system (capacity credit) and thus they save capacity payments for conventional power units •The SMP does not represent the actual generation cost. •The actual additional cost/benefit of RES is not properly represented in the retail bills.

14
20092010Σύνολο διετίας Σύνολο πληρωμών προς ΑΠΕ313385698,0 Σύνολο σημερινού ΕΤ-ΑΠΕ με την υπόθεση ότι ισοσκελίζει ο λογαριασμός κάθε έτος104127231,0 Σύνολο κατανάλωσης (GWh)55,155,2110,3 ΕΤ-ΑΠΕ με ορθότερο υπολογισμό50,766,2116,9 Επιδότηση εμπορίας53,360,8114,1 Ποσά σε εκατ. Ευρώ

16
PeriodBenefit Total RES investments2011-202013,4δισ. € Benefit in the balance of current accounts (ισοζύγιο τρεχουσών συναλλαγών) due to imported fuels savings2011-20205δισ. € CO 2 Savings2011-20201,5δισ. € Additional GDP 2020 due to RES20203,1 – 4% units Additional GDP 2020 due to RES20208,6 - 11bil. € Aggregated increase of GDP due to RES2011-202034 - 61bil. €
 due to imported fuels savings δισ. € CO 2 Savings ,5δισ. € Additional GDP 2020 due to RES20203,1 – 4% units Additional GDP 2020 due to RES20208,6 - 11bil. € Aggregated increase of GDP due to RES bil. €.")
17
PeriodBenefit New employmentup to 202050.000 - 54.000 Benefit for the commerce balance due to RES installed during the period 2011-20102011-203510bil. € Benefit on the General Government Deficit due to RES on 20202020 from -0,5% of GDP is becomes +0,3% up to +1% of GDP Benefit on the Public Deficit due to RES on 2020202015-20%units of GDP Payments to local societies due to RES202070mil. €

18
RES reduce the total generation cost RES contributes significant macroeconomics and development benefits The role of the National Action Plan for RES is crucial

Παρόμοιες παρουσιάσεις


>")

 is.>")


