Κατέβασμα παρουσίασης
Η παρουσίαση φορτώνεται. Παρακαλείστε να περιμένετε

1
Κατάταξη Πανεπιστημίων Και σημεία κριτικής

4
Βασικά στοιχεία για την Ελλάδα

5
5 Shanghai Rankings 2003 QS (αρχικά με THES) και Webometrics Rankings 2004 Διοικητικοί υπάλληλοι στην κατάταξη QS 2005 QS κατάταξη για ασιατικά πανεπιστήμια 2009 URAP Κατάταξη 2010 QS Λατινική Αμερική October 2011 QS Οι καλύτερες πόλεις February 2012 Δημοσιεύσεις για 29 ξεχωριστές ακαδημαϊκές περιοχές June 2012 HEEACT κατάταξη 2007 Times Higher Education διακόπτει με QS 2010
 και Webometrics Rankings 2004 Διοικητικοί υπάλληλοι στην κατάταξη QS 2005 QS κατάταξη για ασιατικά πανεπιστήμια 2009 URAP Κατάταξη 2010 QS Λατινική Αμερική October 2011 QS Οι καλύτερες πόλεις February 2012 Δημοσιεύσεις για 29 ξεχωριστές ακαδημαϊκές περιοχές June 2012 HEEACT κατάταξη 2007 Times Higher Education διακόπτει με QS 2010")
6
Overall indicatorIndividual indicator Percentage weighting Industry Income – innovation Research income from industry (per academic staff) 2.5% International diversity Ratio of international to domestic staff Ratio of international to domestic students 3% 2% Teaching – the learning environment Reputational survey (teaching) PhDs awards per academic Undergrad. admitted per academic Income per academic PhDs/undergraduate degrees awarded 15% 6% 4.5% 2.25% Research – volume, income and reputation Reputational survey (research) Research income (scaled) Papers per research and academic staff Public research income/ total research income 19.5% 5.25% 4.5% 0.75% Citations – research influence Citation impact (normalised average citation per paper) 32.5%
 Research income (scaled) Papers per research and academic staff Public research income/ total research income 19.5% 5.25% 4.5% 0.75% Citations – research influence Citation impact (normalised average citation per paper) 32.5%.")
7
Συστήματα Κατάταξης Πανεπιστημίων

8
ARWU methodology[10] CriterionIndicatorCodeWeightingSource Quality of education Alumni as Nobel laureates & Fields MedalistsNobel laureatesFields Medalists Alumni 10% Official websites of Nobel Laureates & Fields Medalists [Note 1] [Note 1] Quality of faculty Staff as Nobel Laureates & Fields Medalists Highly cited researchers in 21 broad subject categories Award HiCi 20% Official websites of Nobel Laureates & Fields Medalists [Note 1] Thomson Reuters' survey of highly cited researchers [Note 1] [Note 1] Thomson Reuters [Note 1] Research output Papers published in Nature and Science [* 1] [* 1] Papers indexed in Science Citation Index- expanded and Social Science Citation Index N&S PUB 20% Citation index Per capita performance Per capita academic performance of an institution PCP 10%-- 1. Not applicable to institutions specialized in humanities and social sciences whose N&S scores are relocated to other indicators.
![ARWU methodology[10] CriterionIndicatorCodeWeightingSource Quality of education Alumni as Nobel laureates & Fields MedalistsNobel laureatesFields Medalists Alumni 10% Official websites of Nobel Laureates & Fields Medalists [Note 1] [Note 1] Quality of faculty Staff as Nobel Laureates & Fields Medalists Highly cited researchers in 21 broad subject categories Award HiCi 20% Official websites of Nobel Laureates & Fields Medalists [Note 1] Thomson Reuters survey of highly cited researchers [Note 1] [Note 1] Thomson Reuters [Note 1] Research output Papers published in Nature and Science [* 1] [* 1] Papers indexed in Science Citation Index- expanded and Social Science Citation Index N&S PUB 20% Citation index Per capita performance Per capita academic performance of an institution PCP 10%-- 1.](http://images.slideplayer.gr/41/11302959/slides/slide_8.jpg "Not applicable to institutions specialized in humanities and social sciences whose N&S scores are relocated to other indicators..")
11
The need for an international ranking of universities was highlighted in December 2003 in Richard Lambert's review of university-industry collaboration in Britain [9] for HM Treasury, the finance ministry of the United Kingdom. Amongst its recommendations were world university rankings, which Lambert said would help the UK to gauge the global standing of its universities.Richard Lambert [9]HM Treasury The idea for the rankings was credited in Ben Wildavsky's book, The Great Brain Race: How Global Universities are Reshaping the World, [10] to then-editor of Times Higher Education (THE), John O'Leary. THE chose to partner with educational and careers advice company Quacquarelli Symonds (QS) to supply the data, appointing Martin Ince, [11] formerly deputy editor and later a contractor to THE, to manage the project. [10]Times Higher EducationJohn O'LearyQuacquarelli Symonds [11] Between 2004 and 2009, QS produced the rankings in partnership with THE. In 2009, THE announced they would produce their own rankings, the Times Higher Education World University Rankings, in partnership with Thomson Reuters. THE cited a weakness in the methodology of the original rankings, [12] as well as a perceived favoritism in the existing methodology for science over the humanities, [13] as one of the key reasons for the decision to split with QS.Times Higher Education World University RankingsThomson Reuters [12] [13] QS retained the intellectual property in the Rankings and the methodology used to compile them [citation needed] and continues to produce the rankings, now called the QS World University Rankings. [14] THE created a new methodology with Thomson Reuters, published as the Times Higher Education World University Rankings in September 2010.citation needed [14]Times Higher Education World University Rankings
![The need for an international ranking of universities was highlighted in December 2003 in Richard Lambert s review of university-industry collaboration in Britain [9] for HM Treasury, the finance ministry of the United Kingdom.](http://images.slideplayer.gr/41/11302959/slides/slide_11.jpg "Amongst its recommendations were world university rankings, which Lambert said would help the UK to gauge the global standing of its universities.Richard Lambert [9]HM Treasury The idea for the rankings was credited in Ben Wildavsky s book, The Great Brain Race: How Global Universities are Reshaping the World, [10] to then-editor of Times Higher Education (THE), John O Leary. THE chose to partner with educational and careers advice company Quacquarelli Symonds (QS) to supply the data, appointing Martin Ince, [11] formerly deputy editor and later a contractor to THE, to manage the project. [10]Times Higher EducationJohn O LearyQuacquarelli Symonds [11] Between 2004 and 2009, QS produced the rankings in partnership with THE. In 2009, THE announced they would produce their own rankings, the Times Higher Education World University Rankings, in partnership with Thomson Reuters. THE cited a weakness in the methodology of the original rankings, [12] as well as a perceived favoritism in the existing methodology for science over the humanities, [13] as one of the key reasons for the decision to split with QS.Times Higher Education World University RankingsThomson Reuters [12] [13] QS retained the intellectual property in the Rankings and the methodology used to compile them [citation needed] and continues to produce the rankings, now called the QS World University Rankings. [14] THE created a new methodology with Thomson Reuters, published as the Times Higher Education World University Rankings in September 2010.citation needed [14]Times Higher Education World University Rankings.")
12
Methodology of QS World University Rankings IndicatorWeightingElaboration Academic peer review 40% Based on an internal global academic survey Faculty/Student ratio 20% A measurement of teaching commitment Citations per faculty 20%A measurement of research impact Employer reputation 10% Based on a survey on graduate employers International student ratio 5% A measurement of the diversity of the student community International staff ratio 5% A measurement of the diversity of the academic staff

13
Πηγή: OECD and UNESCO Institute for Statistics for most data on non-OECD countries. Table C4.5. See Annex 3 for notes (www.oecd.org/edu/eag2012).

15
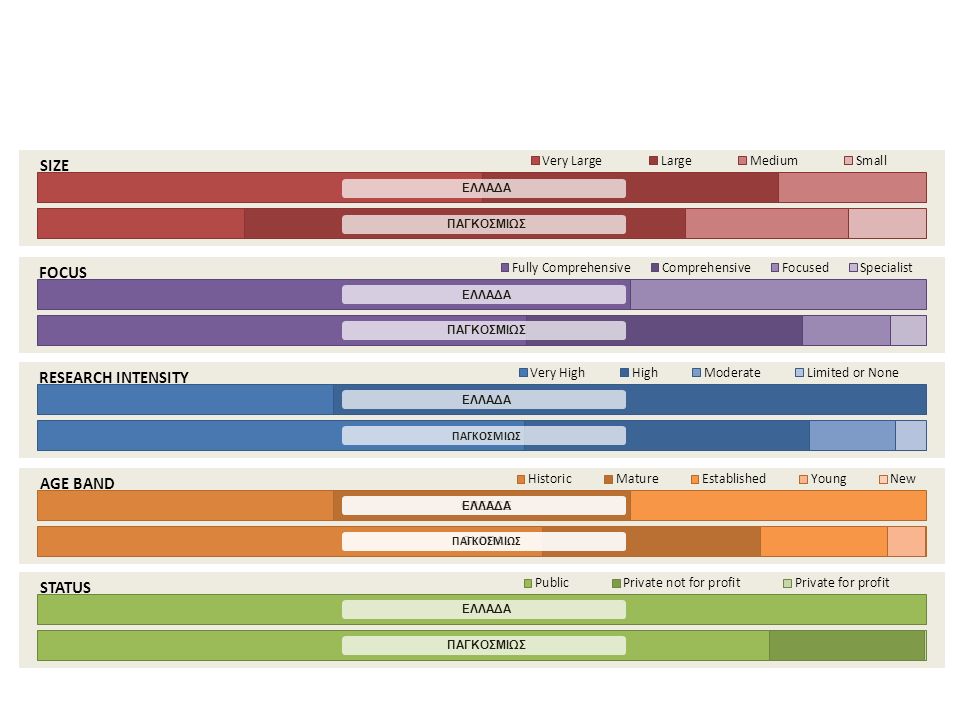
Trusted. Independent. Global.15 COUNTRY REPORT – GREECE More than double the average for the world’s top 600

16
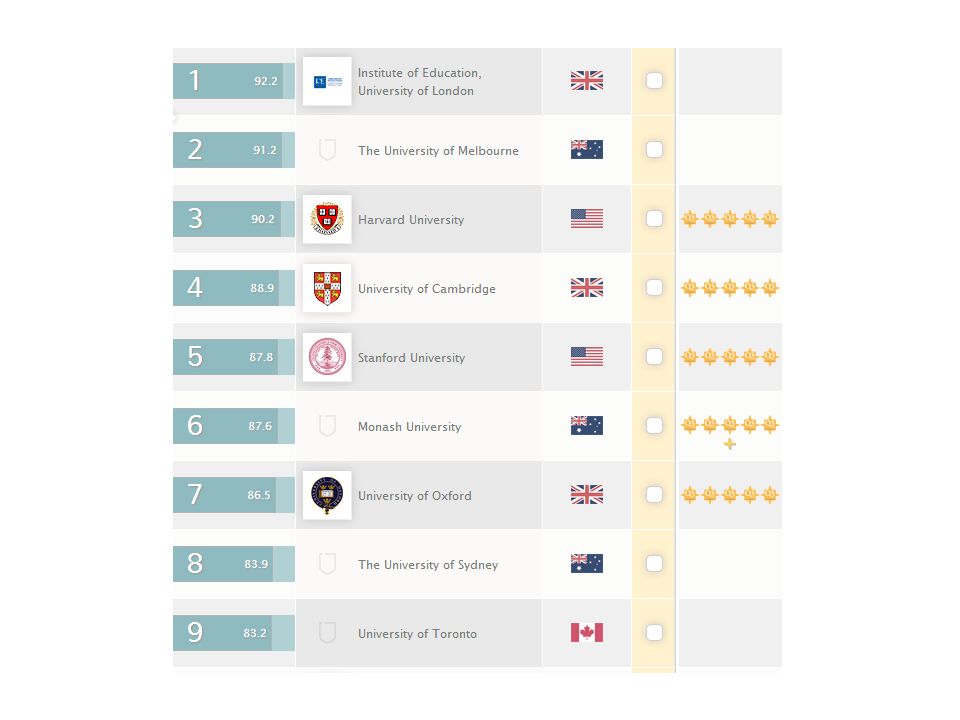
16 Κατάταξη πανεπιστημίων (QS)
")
17
Academic reputation (40%). Μέσω δημοσκόπησης. Το 2013 62 χιλιάδες συμμετέχοντες από πανεπιστήμια. Employer reputation (10%) Το 2013 28 χιλιάδες συμμετέχοντες Student-to-faculty ratio (20%) Citations per faculty (20%) International faculty ratio (5%) & international student ratio (5%)
 Το χιλιάδες συμμετέχοντες Student-to-faculty ratio (20%) Citations per faculty (20%) International faculty ratio (5%) & international student ratio (5%).")
19
ARWUQSWebometricsTHE 1HarvardMITHarvardCaltech 2StanfordCambridgeMITHarvard 3MITHarvardStanford 4BerkeleyUCLBerkeleyOxford 5CambridgeOxfordCornellPrinceton 6CaltechImperialMinnesotaCambridge 7PrincetonYalePennsylvaniaMIT 8ColumbiaChicagoWisconsinImperial 9ChicagoPrincetonUIUCChicago 10OxfordCaltechMichigan StateBerkeley Trusted. Independent. Global.19 Comparing Results August 2012 September 2012October 2011 July 2012

21
Institutions in RangeAverage Rank Range20122011Change20122011Change 1-100000 101-200000 201-300000 301-40001 387 401-50022047548380 501-600220532572400 601-700211654636-180 Overall660554522-32

23
201020112012 ScoreRankScoreRankScoreRank SYSTEM29.53728.63829.339 ACCESS91.8786.2858.025 FLAGSHIP44.43625.84320.149 ECONOMIC19.24017.24420.944 OVERALL46.23139.53732.142

25
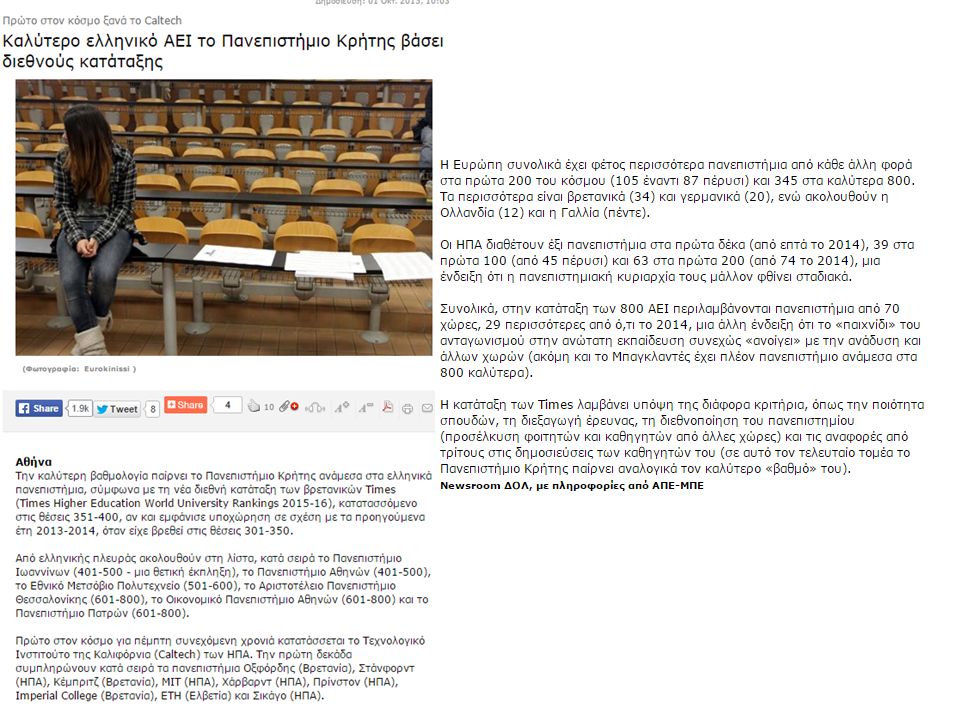
Ίδρυμα 20122011 Αριστοτέλειο Θεσσαλονίκη 451-500 Πανεπιστήμιο Κρήτης 451-500 Εθνικό και Καποδιστριακό Πανεπιστήμιο Αθηνών 501-550387 Πολυτεχνείο 551-600 Πανεπιστήμιο Πατρών 601+551-600 Οικονομικό Πανεπιστήμιο 601+

31
Results: www.topuniversities.comwww.topuniversities.com Methodology & Comment: www.iu.qs.comwww.iu.qs.com Twitter: @bensowter, @worlduniranking Facebook: www.facebook.com/universityrankingswww.facebook.com/universityrankings Email: ben@qs.com; intelligenceunit@qs.comben@qs.comintelligenceunit@qs.com

Παρόμοιες παρουσιάσεις


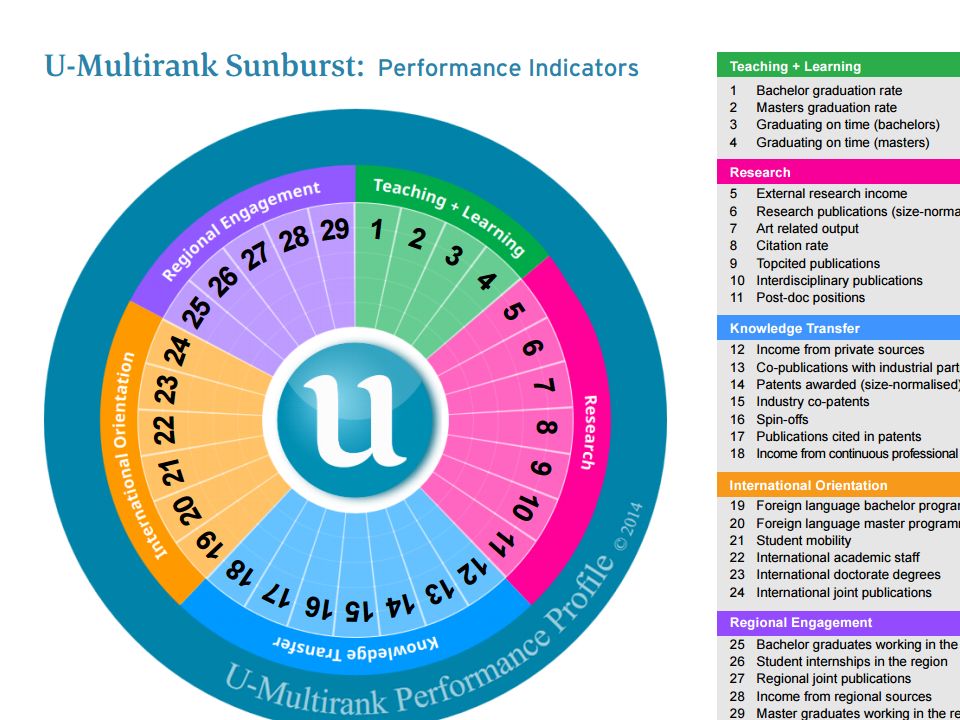


, Performance Indicators (PIs), Key Performance Indicators (KPIs)>")


 ωφελέειν ή μη βλάπτειν ωφελέειν = θεραπευτική παρέμβαση μη βλάπτειν = ασφάλεια ασθενών.>")


