Κατέβασμα παρουσίασης
Η παρουσίαση φορτώνεται. Παρακαλείστε να περιμένετε

1
Πίνακες Κοινωνικής Λογιστικής και Εμπειρικά Υποδείγματα Γενικής Ισορροπίας Μάθημα Εφαρμοσμένη Αναπτυξιακή Πολιτική

2
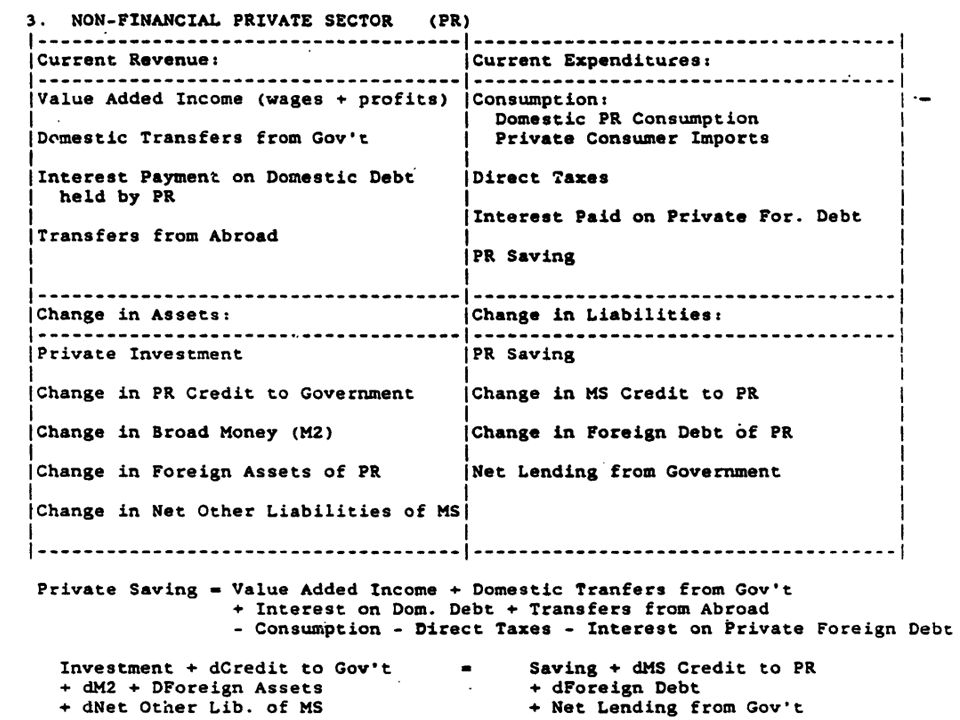
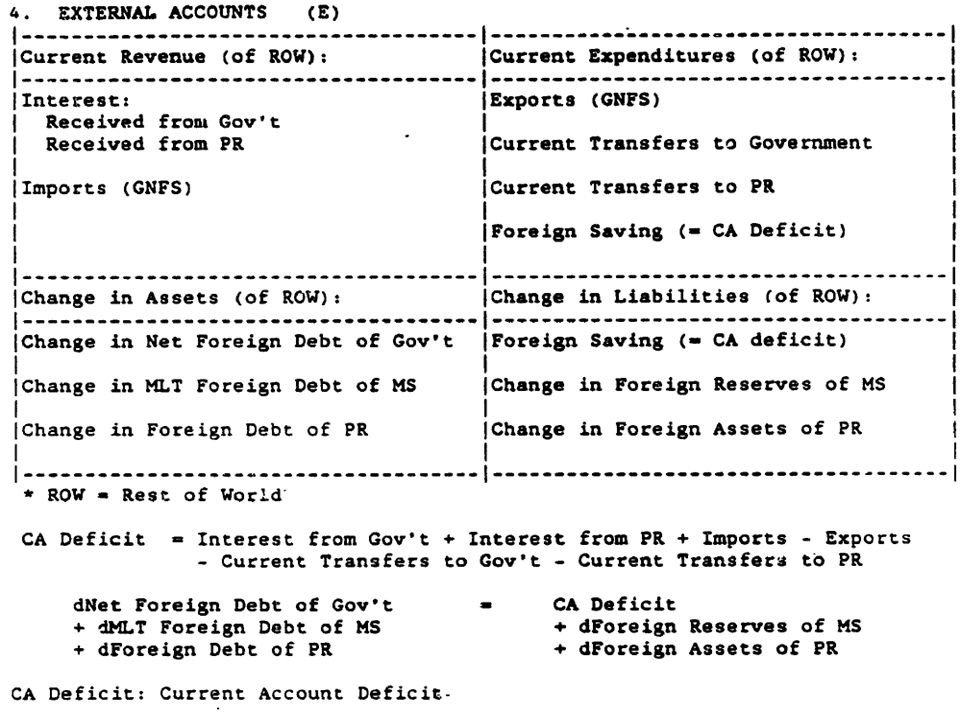
Consistency Framework for Macroeconomic Accounting (refs. IMF Macroeconomic Accounts Statistics: Overview and W. Easterly “ A consistency Framework for Macroeconomic Analysis) Consistency is simply the requirement that budget constraints are observed for all participants in the economy. Budget constraints at the economy-wide level in four identities 1. National accounts (income=expenditure) 2. Fiscal identity (fiscal deficit=total public sector borrowing and reserve changes) 3. Balance of payments identity (current account deficit=foreign borrowing and foreign exchange reserve changes) 4. Monetary identity (increase in money supply=increase in domestic credit and foreign reserves) Above 4 identities imply the private sector budget constraint Consistency framework should require that all 4 of the above identities should be simultaneously satisfied ex-post
 Consistency is simply the requirement that budget constraints are observed for all participants in the economy. Budget constraints at the economy-wide level in four identities 1. National accounts (income=expenditure) 2. Fiscal identity (fiscal deficit=total public sector borrowing and reserve changes) 3. Balance of payments identity (current account deficit=foreign borrowing and foreign exchange reserve changes) 4. Monetary identity (increase in money supply=increase in domestic credit and foreign reserves) Above 4 identities imply the private sector budget constraint Consistency framework should require that all 4 of the above identities should be simultaneously satisfied ex-post.")
3
Example Economic report projects increase in growth in country X from 2.4% in 2010 to 4.8% by year 2020. To support this, the rate if investment is projected to double from 12% of GNP to 24% of GNP. At same time fiscal deficit of 6% of GNP reduced to zero by 2020, financed entirely by tax increases. Public investments and consumption stay constant at 6% and 10% of GNP respectively. Inflation is projected to remain constant at 10% per year. Finally CA deficit remains stable at 3% of GNP. Is this consistent? Yes, but at very unrealistic values of private sector investment, saving and financial behavior. Private investment ratio increases from 6% of GNP to 18 % of GNP, since total investment doubles while public investment constant. To finance higher investment with given CA deficit, private savings must go from 9% of GNP to 15% of GNP, while public savings from 0 to 6% of GNP. But higher public saving is financed from taxes, which decreases disposable income. Hence private saving as a percentage of disposable income will have to increase from 10% of income to 18%. This is difficult to imagine.

4
Example (continued) These values of saving and investment also have implausible implications for financial aggregates. Let us assume for this example that 60 percent of saving goes into financial asset accumulation,with the other 40 percent going directly into self-financed investment. Let us also assume that the initial ratio of financial assets to GNP is 48 percent,which is the steady state value consistent with the initial saving rate and growth rate. Then the increase in saving rate would imply an increase in the ratio of financial assets to GNP in the economy from 48 percent to 59 percent by the year2020. The long run effect is even greater, since the new steady state ratio of financial assets to GNP will be 68 percent. Since the public deficit is being reduced, the implications forprivate sector credit would be even stronger. Real private sector credit would be growing at around 14 percent per year for most of the period. In the long run, the ratio of private credit to GNP will be 90 percent, an astonishing increase over the initial value of 27 percent. The public sector would be a net creditor to the banking system in the amount of 22 percent of GNP in the long run.

5
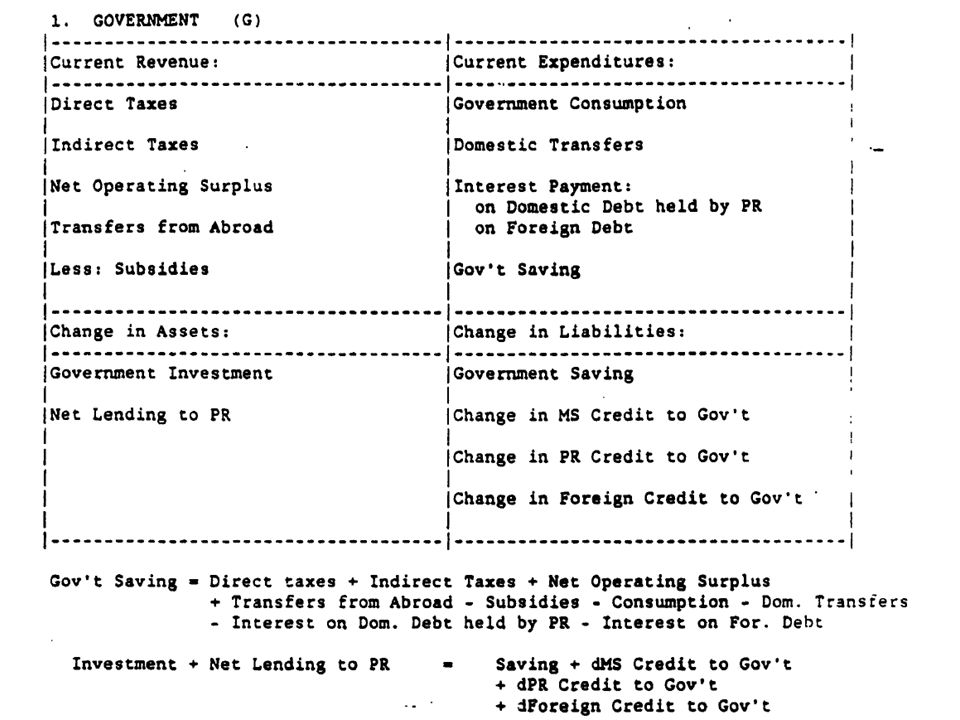
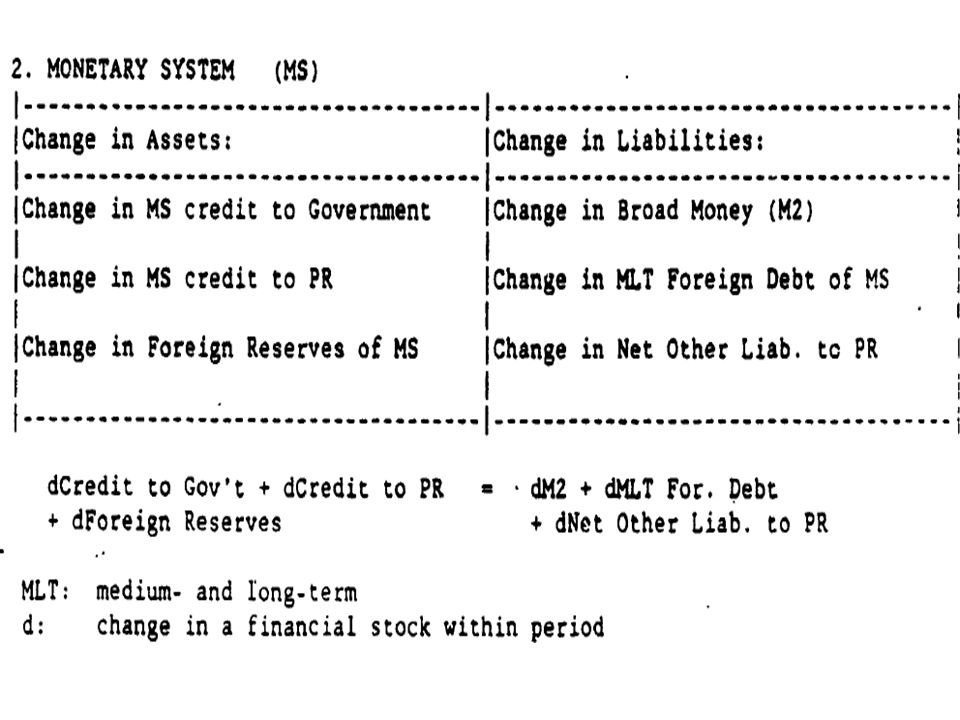
Institutional units in an economy Institutional units those that can have independent assets, liabilities and engage in economic activities with other entities Five accounts (1) government, (2) monetary system (3) nonfinancial private sector, (4) balance of payments, (5) national accounts. Types of institutions 1. Nonfinancial corporations sector 2. Financial corporations sector 3. General government sector 4. Nonprofit institutions serving the household (NPISH)sector 5. Household sector
sector 5. Household sector.")
6
Residence Residents=institutional units that have closer tie with economic territory of the country than with any other country. Based on where unit’s center of interest lies Economic territory is a geographical territory administered by a government An institutional unit has a center of economic interest in the country when there exists some location from which it engages in economic activities. Governments are resident even if they carry activities in other countries (embassies located abroad are treated as residents, while embassies of other countries are not treated as residents of the host country). Corporations are resident of a country when engaged in significant amounts of production there, of own land or buildings. Foreign branches of resident corporations are regarded as non-resident. Off-shores are resident of the economy where the offshore is located. A household is resident when it maintains a dwelling. People with temporary absences (short term migrants) are regarded as residents of the country where they maintain their household.
. Corporations are resident of a country when engaged in significant amounts of production there, of own land or buildings. Foreign branches of resident corporations are regarded as non-resident. Off-shores are resident of the economy where the offshore is located. A household is resident when it maintains a dwelling. People with temporary absences (short term migrants) are regarded as residents of the country where they maintain their household..")
7
Territory The economic territory of a country consists of the geographic territory administered by a government. Within the territory, persons, goods, and capital circulate freely. It includes airspace, territorial waters, and continental shelf lying in international waters over which the country enjoys exclusive rights or over which it has, or claims to have, jurisdiction with respect to economic exploitation. It also includes enclaves in the rest of the world, such as embassies, consulates, and military bases.

8
Stocks A stock is a magnitude measured at a point in time. They are positions or holdings of assets or liabilities. Assets are owned by an institutional unit and can provide economic benefit (machines, buildings, financial stocks, cash, deposits). Stocks are recorded in balance sheets at the beginning and end of period. Stocks are valued at current market prices on the day the balance sheet is drawn up. Assets are entities over which institutions have property rights (non-financial or financial). Liabilities are financial obligations of one unit to another, hence counterpart to financial assets (currency, deposits, securities, shares). Balance sheet is assets (left side) and liabilities (right side) of the entity (unit). Difference between unit’s stock of assets and liabilities is unit’s net worth.
. Stocks are recorded in balance sheets at the beginning and end of period. Stocks are valued at current market prices on the day the balance sheet is drawn up. Assets are entities over which institutions have property rights (non-financial or financial). Liabilities are financial obligations of one unit to another, hence counterpart to financial assets (currency, deposits, securities, shares). Balance sheet is assets (left side) and liabilities (right side) of the entity (unit). Difference between unit’s stock of assets and liabilities is unit’s net worth..")
9
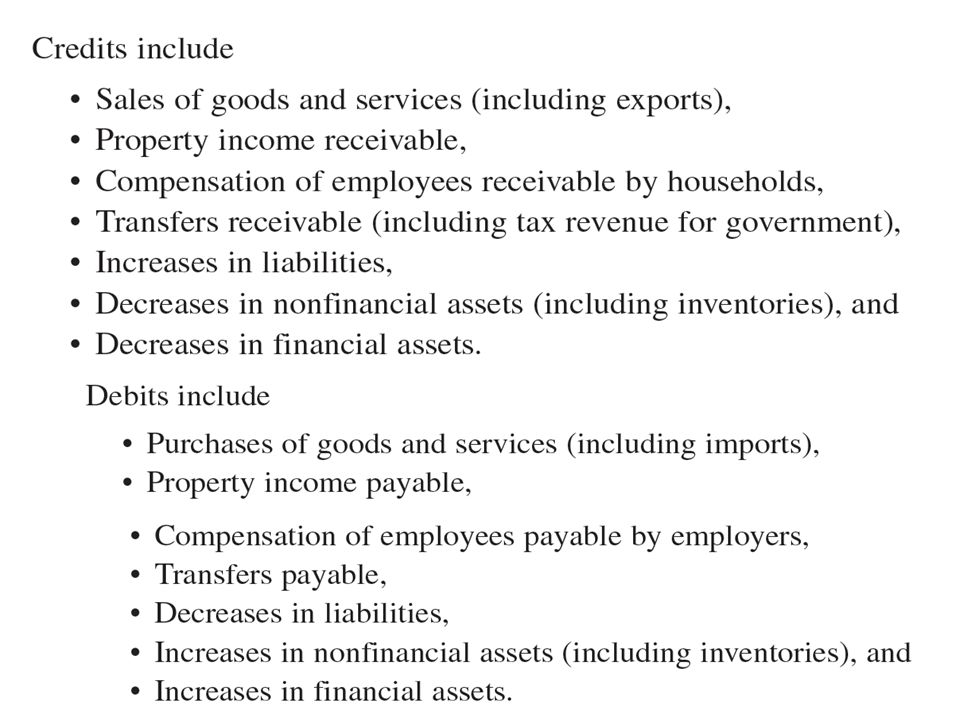
Flows Flows are economic magnitudes measured with reference to a period of time. They include. 1. Transactions (exchanges or transfers) 2. Other economic flows (capital gains and losses, changes in volumes of assets) Flows measure the changes in the value of stocks Fundamental identity Stock (end)=Stock (beginning)+transactions+other economic flows
 2. Other economic flows (capital gains and losses, changes in volumes of assets) Flows measure the changes in the value of stocks Fundamental identity Stock (end)=Stock (beginning)+transactions+other economic flows.")
10
Accounting Every flow recorded twice as debit and as credit Credit =increase in an asset, decrease in liability or decrease in net worth Debit=increase in liability, decrease in asset or increase in net worth of an institutional unit. If household provides labor to a corporation in exchange for cash, the household sector records this as a debit entry for the increase in cash asset, and a credit for its increased net worth (the wages and salaries revenue). Corporation would record this as credit for the reduction in cash, and debit for the decrease in its net worth (the wages and salaries expense)
. Corporation would record this as credit for the reduction in cash, and debit for the decrease in its net worth (the wages and salaries expense).")
12
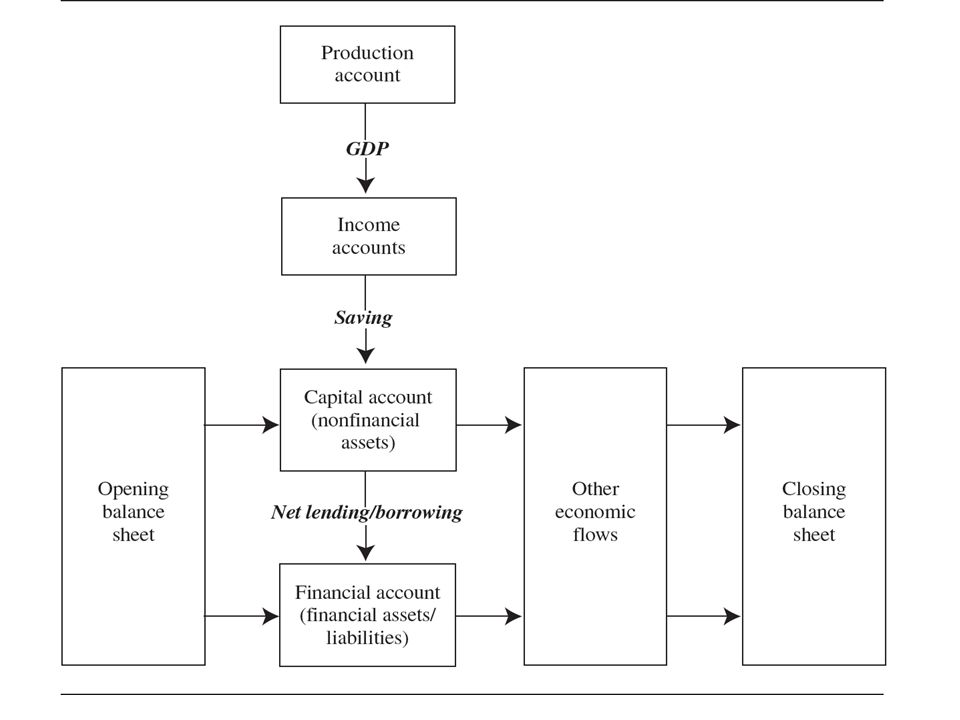
National accounts Current accounts, accumulation accounts and balance sheets Current accounts=production accounts and income accounts Accumulation accounts=capital accounts (non- financial assets transactions), financial accounts (changes in assets and liabilities), and accounts for other economic flows. Balance sheets show stocks of assets and liabilities at beginning and end of each period. Balancing item is net worth

14
Definition of GDP GDP is the sum of value added produced by all institutional units resident in the domestic economy plus the value of taxes less subsidies on products. In the definition, value added equals the value of output less the values of goods and services (intermediate consumption) used to produce this output. Also in the definition, taxes on products have a direct bearing on measuring GDP. In its treatment of taxes, the 1993 SNA distinguishes between taxes levied because production takes place but that cannot be related to a specific product, and taxes levied on the value or volume of specific products. Examples of the nonspecific product taxes are import duties (taxes on products) and payroll taxes (other taxes on production), whereas a sales tax is an example of a specific product tax.
 used to produce this output. Also in the definition, taxes on products have a direct bearing on measuring GDP. In its treatment of taxes, the 1993 SNA distinguishes between taxes levied because production takes place but that cannot be related to a specific product, and taxes levied on the value or volume of specific products. Examples of the nonspecific product taxes are import duties (taxes on products) and payroll taxes (other taxes on production), whereas a sales tax is an example of a specific product tax..")
15
Expenditure approach: Goods and services account

16
Gross domestic product

17
Total resources=outputs+imports Total uses=consumption +investment+ exports GDP=C+I+G+(X-M)
")
18
Current accounts

19
Capital and financial accounts

20
Balance sheet and accumulation accounts

26
Συνοπτική παρουσίαση του Πίνακα Κοινωνικής Λογιστικής του 1996 (τρέχουσες τιμές, εκατ. δραχμές)
")
27
Κατανομή εισοδημάτων στις κατηγορίες των νοικοκυριών με βάση την ΕΟΠ 93/94 (1)
")
28
Κατανομή εισοδημάτων στα νοικοκυριά με βάση την ΕΟΠ 93/94 (2)
")
29
Κατανομή εισοδημάτων στα νοικοκυριά με βάση την ΕΟΠ 93/94 (3)
")
30
Τα 18 προϊόντα – κλάδοι του Πίνακα Κοινωνικής Λογιστικής

31
Μήτρα Ενδιάμεσων Χρήσεων (18Χ18) κατά Προϊόν (1996, δισεκ. δραχμές).
 κατά Προϊόν (1996, δισεκ. δραχμές).")
32
Μήτρα ενδιαμέσων χρήσεων (2)
")
33
Διανομή Προστιθέμενης Αξίας Παραγωγής κατά προϊόν (1996, δισεκ. δραχμές).
.")
34
Έσοδα Δημόσιου Τομέα και διάρθρωση κατά προϊόν (1996) σε δισεκ. δραχμές
 σε δισεκ. δραχμές")
35
Εξωτερικός Τομέας και Διάρθρωση Εισαγωγών και Εξαγωγών κατά προϊόν

36
Διανομή εσόδων συντελεστών στα νοικοκυριά (1996 δισ. δρχ.)
")
37
Ποσοστιαία διάρθρωση των εισοδημάτων από εργασία στα νοικοκυριά

38
Μεταβιβάσεις από νοικοκυριά σε νοικοκυριά (δισ. Δρχ.)
")
39
Μεταβιβάσεις από νοικοκυριά σε νοικοκυριά (δισ. Δρχ.) (2)
 (2)")
40
Μεταβιβάσεις στα Νοικοκυριά από Επιχειρήσεις, Δημόσιο, Εξωτ. Τομέα (απόλυτα μεγέθη σε δισεκ. δρχ. και % διάρθρωση).
..")
41
Κατανάλωση Νοικοκυριών κατά προϊόν (1996, δισεκ. δραχμές)
")
42
Άμεσοι Φόροι, Κοινωνική Ασφάλιση, Αποταμίευση των Νοικοκυριών.

43
Κατανάλωση Δημόσιου Τομέα και ποσοστιαία διάρθρωση κατά προϊόν.

44
Λογαριασμοί Επενδύσεων - Μεταβολές Αποθεμάτων.

45
Φορολογική επιβάρυνση των νοικοκυριών από την άμεση φορολογία

46
Δηλωθέν εισόδημα και φόρος ανά κατηγορία επαγγέλματος (ανά φορολογική δήλωση)
")
47
Εκτίμηση φοροαποφυγής (ποσοστιαίες διαφορές στα εισοδήματα που δηλώθηκαν στην ΕΟΠ 1999, και στη Φορολογία Εισοδήματος 2000)
")
Παρόμοιες παρουσιάσεις


 Models Course Development Microeconomics.>")


