Κατέβασμα παρουσίασης
Η παρουσίαση φορτώνεται. Παρακαλείστε να περιμένετε

1
Africa 2013 ΕΛΛΗΝΟ – ΑΦΡΙΚΑΝΙΚΟ ΕΠΙΜΕΛΗΤΗΡΙΟ

11
300 εκατ. δεν έχουν πρόσβαση σε πόσιμο νερό. 95 % της καλλιεργήσιμης γης δεν αρδεύεται.

12
ΕΛΛΗΝΟ – ΑΦΡΙΚΑΝΙΚΟ ΕΠΙΜΕΛΗΤΗΡΙΟ

16
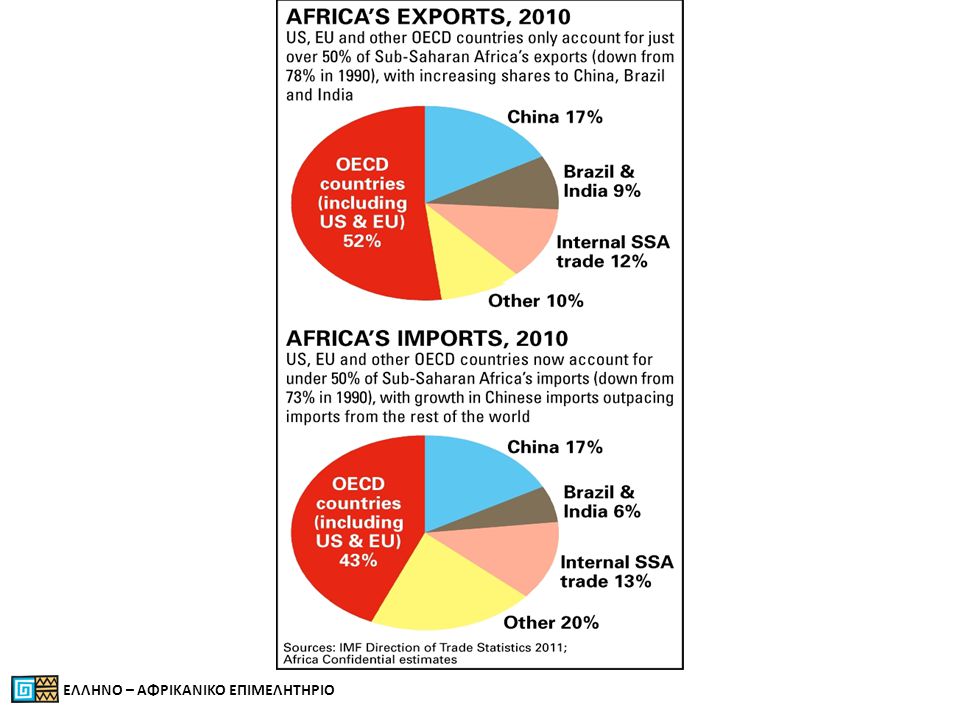
EU – AFRICAN TRADE

17
ΕΛΛΗΝΟ – ΑΦΡΙΚΑΝΙΚΟ ΕΠΙΜΕΛΗΤΗΡΙΟ EU – AFRICAN TRADE

18
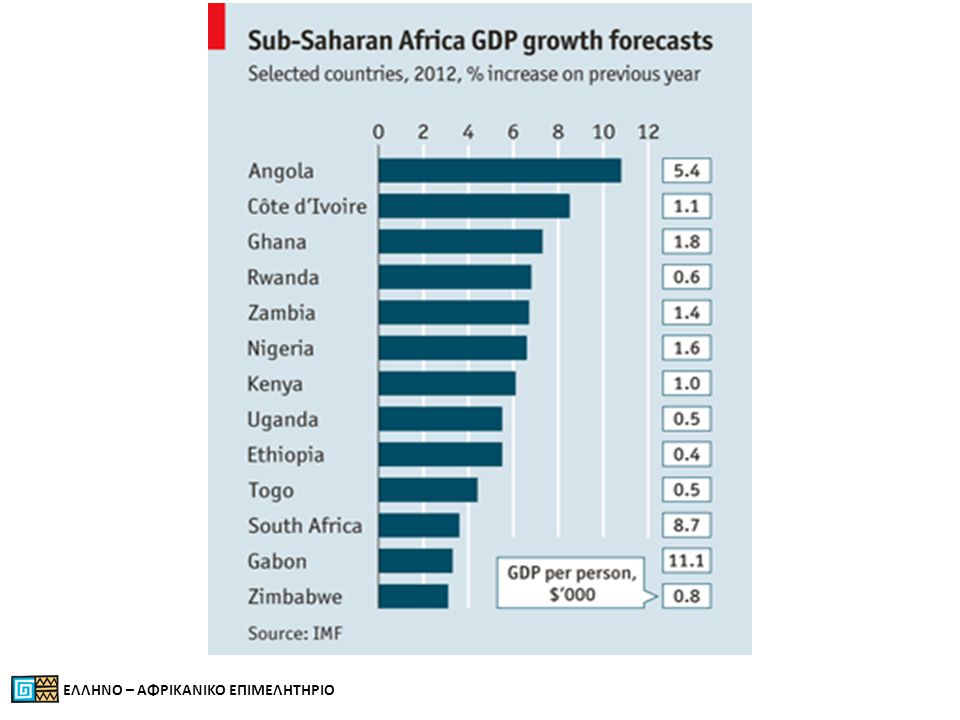
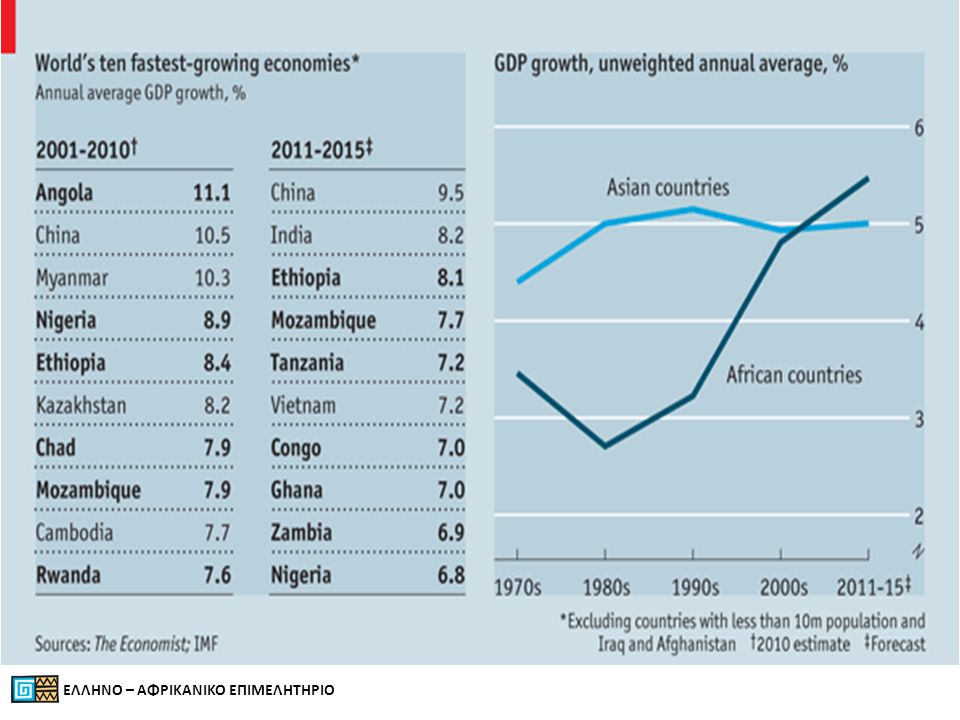
ΕΛΛΗΝΟ – ΑΦΡΙΚΑΝΙΚΟ ΕΠΙΜΕΛΗΤΗΡΙΟ • Η Αφρική βρίσκεται σήμερα στο σημείο της οικονομικής απογείωσης (take off) που βρισκόταν η Κίνα στη δεκαετία του ’80. Έχει τις υψηλότερες αποδόσεις κεφαλαίου στον κόσμο (εν μέρει αποζημίωση του υψηλού ρίσκου). Όσοι επενδύουν σήμερα στην ήπειρο επενδύουν μακροχρόνια.
. Όσοι επενδύουν σήμερα στην ήπειρο επενδύουν μακροχρόνια..")
19
South Africa 2013

20
ΕΛΛΗΝΟ – ΑΦΡΙΚΑΝΙΚΟ ΕΠΙΜΕΛΗΤΗΡΙΟ

21
A GLOBALLY COMPETITIVE ECONOMY South Africa faced well in the most recent World Economic Forum’s Global Competitiveness Index South Africa’s overall ranking improved to 50 in 2011-2012 out of 142 countries, due to impressive gains in accountability of private institutions, strength of investor protection and technological readiness. South Africa’s flagship advantages continued to shine: • Ranked first in strength of auditing and reporting standards • Ranked second in efficacy of corporate boards • Ranked third in protection of minority shareholders’ interests • Ranked seventh in effectiveness of anti-monopoly policy • Ranked third in availability of financial services • Ranked fourth in financing through the local equities market • Ranked second in soundness of banks • Ranked first in regulation of securities exchange • Ranked eighth in legal rights • South Africa’s absolute score remained at 4.3 (on a scale of one to seven) • South Africa’s 50th overall ranking is sub-Saharan Africa’s highest • South Africa is second only to China among the Brazil-Russia- India-China-South Africa (BRICS) economic grouping ΕΛΛΗΝΟ – ΑΦΡΙΚΑΝΙΚΟ ΕΠΙΜΕΛΗΤΗΡΙΟ
 • South Africa’s 50th overall ranking is sub-Saharan Africa’s highest • South Africa is second only to China among the Brazil-Russia- India-China-South Africa (BRICS) economic grouping ΕΛΛΗΝΟ – ΑΦΡΙΚΑΝΙΚΟ ΕΠΙΜΕΛΗΤΗΡΙΟ.")
22
THE SOUTH AFRICAN SCORECARD • Country size: 28th in the world, by population and GDP • Local currency versus the US dollar: Second best in the world • Most democratic: Ranked 43rd out of 150 countries (ahead of China, India, Brazil, Russia) • Size of gold reserves: 24th out of 92 countries • Protection of investors: 10th out of 183 countries • Size of exports: 41st out of 192 countries • Agricultural output: In the world’s top 20 • Press freedom: 41 out of 176 countries(higher than France, Italy, Spain, Portugal) • “Big Mac” index: 11th out of 60 countries • Railroad network: World’s 18th longest • Road network: World’s 15th biggest • Electricity production: World’s 19th biggest • Budget: South Africa’s Open Budget Index score in 2010 was 92 out of 100, the highest score of the 94countries surveyed • Nation brand: The most valuable on the continent in 2011according to UK-based Brand Finance • Tourism: Voted the ninth best destination in the world
 • Size of gold reserves: 24th out of 92 countries • Protection of investors: 10th out of 183 countries • Size of exports: 41st out of 192 countries • Agricultural output: In the world’s top 20 • Press freedom: 41 out of 176 countries(higher than France, Italy, Spain, Portugal) • Big Mac index: 11th out of 60 countries • Railroad network: World’s 18th longest • Road network: World’s 15th biggest • Electricity production: World’s 19th biggest • Budget: South Africa’s Open Budget Index score in 2010 was 92 out of 100, the highest score of the 94countries surveyed • Nation brand: The most valuable on the continent in 2011according to UK-based Brand Finance • Tourism: Voted the ninth best destination in the world")
23
ΕΛΛΗΝΟ – ΑΦΡΙΚΑΝΙΚΟ ΕΠΙΜΕΛΗΤΗΡΙΟ SOUTH AFRICA ECONOMY PROFILE 1.GDP – per capita$11,300 (2012 est.) $11,100 (2011 est.) $10,900 (2010 est.) 2.GDP – compositionagriculture: 2.4% by sectorindustry: 32.1% services: 64.9% 3. Labor force – by agriculture: 9% occupationindustry: 26% services: 65% 4.Unemployment 24.4% (2012 est.) rate24.9% (2011 est.)
 rate24.9% (2011 est.).")
24
SOUTH AFRICA ECONOMY PROFILE 1.Public Debt 43.3% of GDP (2012 est.) 38.6% of GDP (2011 est.) 2.Agriculture products corn, wheat, fruits sugarcane, beef, vegetables, poultry, mutton, wool, dairy products 3. Industries mining (world’s largest producer of platinum, gold, chromium), automobile assembly, metalworking, machinery, textiles, iron and steel, chemicals, fertilizer, foodstuffs, commercial ship repair ΕΛΛΗΝΟ – ΑΦΡΙΚΑΝΙΚΟ ΕΠΙΜΕΛΗΤΗΡΙΟ
, automobile assembly, metalworking, machinery, textiles, iron and steel, chemicals, fertilizer, foodstuffs, commercial ship repair ΕΛΛΗΝΟ – ΑΦΡΙΚΑΝΙΚΟ ΕΠΙΜΕΛΗΤΗΡΙΟ.")
25
SOUTH AFRICA ECONOMY PROFILE 1.Export - commodities gold, diamonds, platinum, other metals and minerals, machinery and equipment 2. Exports – partners China 12.7% US 8.6% Japan 7.9% Germany 6% UK 4.1% 3.Imports - commodities machinery, chemicals, petroleum products, scientific instruments, foodstuffs 4. Imports – partnersChina 14.3% Germany 10.7% US 8% Japan 4.7% Saudi Arabia 4.5% India 4%, UK 4% ΕΛΛΗΝΟ – ΑΦΡΙΚΑΝΙΚΟ ΕΠΙΜΕΛΗΤΗΡΙΟ

26
EU – AFRICAN TRADE • South Africa is the EU’s largest trading partner in Africa. A member of the Caribbean Pacific group of countries, South Africa is by far the strongest sub- Saharan Africa’s Economies. • South Africa’s exports to the EU are growing and the composition of these exports is becoming more diverse. South Africa is gradually moving from mainly commodity-based products to a more diversified export profile that includes manufactured products. • South Africa’s primary exports to the EU are fuels and mining products, machinery and transport equipment, and other semi-manufactured goods. • EU exports to South Africa are dominated by machinery and transport equipment, chemicals and other semi-machinery. ΕΛΛΗΝΟ – ΑΦΡΙΚΑΝΙΚΟ ΕΠΙΜΕΛΗΤΗΡΙΟ

27
SOUTH AFRICA AS AFRICA’S GATEWAY • International Companies choose South Africa as the preferred entry point to Africa. • Investors and traders establish their African Headquarters in South Africa and use it as a springboard for business in other African States. • South Africa is the preferred transport and logistics hub for Southern Africa thanks to its superior infrastructure and services industry. • Since 1994 South Africa is also one of the biggest investors in other African Countries. ΕΛΛΗΝΟ – ΑΦΡΙΚΑΝΙΚΟ ΕΠΙΜΕΛΗΤΗΡΙΟ

Παρόμοιες παρουσιάσεις