Κατέβασμα παρουσίασης
Η παρουσίαση φορτώνεται. Παρακαλείστε να περιμένετε

2
Copyright © 2015 AACE. May not be reprinted in any form without express written permission from AACE. Age ≥45 years without other risk factors Family history of T2D CVD Overweight BMI ≥30 kg/m 2 BMI 25-29.9 kg/m 2 plus other risk factors* Sedentary lifestyle Member of an at-risk racial or ethnic group: Asian, African American, Hispanic, Native American, and Pacific Islander Dyslipidemia HDL-C <35 mg/dL Triglycerides >250 mg/dL IGT, IFG, and/or metabolic syndrome PCOS, acanthosis nigricans, NAFLD Hypertension (BP >140/90 mm Hg or therapy for hypertension) History of gestational diabetes or delivery of a baby weighing more than 4 kg (9 lb) Antipsychotic therapy for schizophrenia and/or severe bipolar disease Chronic glucocorticoid exposure Sleep disorders † in the presence of glucose intolerance Screen at-risk individuals with glucose values in the normal range every 3 years Consider annual screening for patients with 2 or more risk factors Criteria for Screening for T2D and Prediabetes in Asymptomatic Adults 2 *At-risk BMI may be lower in some ethnic groups; consider using waist circumference. † Obstructive sleep apnea, chronic sleep deprivation, and night shift occupations. BMI = body mass index; BP = blood pressure; CVD=cardiovascular disease; HDL-C = high density lipoprotein cholesterol; IFG = impaired fasting glucose; IGT = impaired glucose tolerance; NAFLD = nonalcoholic fatty liver disease; PCOS = polycystic ovary syndrome; T2D, type 2 diabetes. Q1. How is diabetes screened and diagnosed?
 History of gestational diabetes or delivery of a baby weighing more than 4 kg (9 lb) Antipsychotic therapy for schizophrenia and/or severe bipolar disease Chronic glucocorticoid exposure Sleep disorders † in the presence of glucose intolerance Screen at-risk individuals with glucose values in the normal range every 3 years Consider annual screening for patients with 2 or more risk factors Criteria for Screening for T2D and Prediabetes in Asymptomatic Adults 2 *At-risk BMI may be lower in some ethnic groups; consider using waist circumference. † Obstructive sleep apnea, chronic sleep deprivation, and night shift occupations. BMI = body mass index; BP = blood pressure; CVD=cardiovascular disease; HDL-C = high density lipoprotein cholesterol; IFG = impaired fasting glucose; IGT = impaired glucose tolerance; NAFLD = nonalcoholic fatty liver disease; PCOS = polycystic ovary syndrome; T2D, type 2 diabetes. Q1. How is diabetes screened and diagnosed .")
3
Copyright © 2015 AACE. May not be reprinted in any form without express written permission from AACE. Diagnostic Criteria for Prediabetes and Diabetes in Nonpregnant Adults 3 NormalHigh Risk for DiabetesDiabetes FPG <100 mg/dL IFG FPG ≥100-125 mg/dL FPG ≥126 mg/dL 2-h PG <140 mg/dL IGT 2-h PG ≥140-199 mg/dL 2-h PG ≥200 mg/dL Random PG ≥200 mg/dL + symptoms* A1C <5.5% 5.5 to 6.4% For screening of prediabetes † ≥6.5% Secondary ‡ *Polydipsia (frequent thirst), polyuria (frequent urination), polyphagia (extreme hunger), blurred vision, weakness, unexplained weight loss. † A1C should be used only for screening prediabetes. The diagnosis of prediabetes, which may manifest as either IFG or IGT, should be confirmed with glucose testing. ‡ Glucose criteria are preferred for the diagnosis of DM. In all cases, the diagnosis should be confirmed on a separate day by repeating the glucose or A1C testing. When A1C is used for diagnosis, follow-up glucose testing should be done when possible to help manage DM. FPG, fasting plasma glucose; IFG, impaired fasting glucose; IGT, impaired glucose tolerance; PG, plasma glucose. Q1. How is diabetes screened and diagnosed?
, polyuria (frequent urination), polyphagia (extreme hunger), blurred vision, weakness, unexplained weight loss. † A1C should be used only for screening prediabetes. The diagnosis of prediabetes, which may manifest as either IFG or IGT, should be confirmed with glucose testing. ‡ Glucose criteria are preferred for the diagnosis of DM. In all cases, the diagnosis should be confirmed on a separate day by repeating the glucose or A1C testing. When A1C is used for diagnosis, follow-up glucose testing should be done when possible to help manage DM. FPG, fasting plasma glucose; IFG, impaired fasting glucose; IGT, impaired glucose tolerance; PG, plasma glucose. Q1. How is diabetes screened and diagnosed .")
4
Copyright © 2015 AACE. May not be reprinted in any form without express written permission from AACE. Diagnostic Criteria for Gestational Diabetes TestScreen at 24-28 weeks gestation FPG, mg/dL>92 1-h PG*, mg/dL≥180 2-h PG*, mg/dL≥153 *Measured with an OGTT performed 2 hours after 75-g oral glucose load. FPG, fasting plasma glucose; OGTT, oral glucose tolerance test; PG, plasma glucose. Q1. How is diabetes screened and diagnosed? 4

5
Copyright © 2015 AACE. May not be reprinted in any form without express written permission from AACE. AACE. Endocrine Pract. 2010;16:155-156. AACE Recommendations for A1C Testing A1C should be considered an additional optional diagnostic criterion, not the primary criterion for diagnosis of diabetes When feasible, AACE/ACE suggest using traditional glucose criteria for diagnosis of diabetes A1C is not recommended for diagnosing type 1 diabetes A1C is not recommended for diagnosing gestational diabetes 5 Q1. How is diabetes screened and diagnosed?

6
Copyright © 2015 AACE. May not be reprinted in any form without express written permission from AACE. AACE Recommendations for A1C Testing A1C levels may be misleading in several ethnic populations (for example, African Americans) A1C may be misleading in some clinical settings Hemoglobinopathies Iron deficiency Hemolytic anemias Thalassemias Spherocytosis Severe hepatic or renal disease AACE/ACE endorse the use of only standardized, validated assays for A1C testing 6 AACE. Endocrine Pract. 2010;16:155-156. Q1. How is diabetes screened and diagnosed?
 A1C may be misleading in some clinical settings Hemoglobinopathies Iron deficiency Hemolytic anemias Thalassemias Spherocytosis Severe hepatic or renal disease AACE/ACE endorse the use of only standardized, validated assays for A1C testing 6 AACE. Endocrine Pract. 2010;16: Q1. How is diabetes screened and diagnosed .")
7
Causes: Genes and the Environment 3–5% increase in T1 consistently T2 from <2–25% of new onset diabetes SEARCH for Diabetes in Youth Study Group; Liese AD, D’Agostino RB Jr, Hamman RF, et al. The burden of diabetes mellitus among US youth: prevalence estimate from the SEARCH for Diabetes in Youth Study. Pediatrics. 2006;118(4):1510–1518
:1510–1518.")
8
Copyright © 2015 AACE. May not be reprinted in any form without express written permission from AACE. Diagnosing Type 1 Diabetes (T1D) Usually characterized by insulin deficiency and dependency Document levels of insulin and C-peptide Test for autoantibodies* Insulin Glutamic acid decarboxylase Pancreatic islet cells (tyrosine phosphatase IA-2) Zinc transporter (ZnT8) May occur in overweight or obese as well as lean individuals Q1. How is diabetes screened and diagnosed? *Evidence of autoimmunity may be absent in idiopathic T1D. 8
 Usually characterized by insulin deficiency and dependency Document levels of insulin and C-peptide Test for autoantibodies* Insulin Glutamic acid decarboxylase Pancreatic islet cells (tyrosine phosphatase IA-2) Zinc transporter (ZnT8) May occur in overweight or obese as well as lean individuals Q1. How is diabetes screened and diagnosed. *Evidence of autoimmunity may be absent in idiopathic T1D. 8.")
9
Why We Do It Better Control Reduces Complications 55.0 29.8 23.9 5.1 13.4 13.0 7.9 16.4 5.0 2.5 0 10 20 30 40 50 60 Retinopathy Progression Laser Rx 1 Micro- albuminuria 2 Albuminuria 2 Clinical Neuropathy 3 Conventional Intensive 76% Risk Reduction 59% 39% 54% 64% Cumulative Incidence (%) 1.DCCT Research Group, Ophthalmology. 1995;102:647-661 2.DCCT Research Group, Kidney Int. 1995;47:1703-1720 3.DCCT Research Group. Ann Intern Med. 1995;122:561-568.

10
| 10 36% χαμηλότερη με την εντατική έναντι της συμβατικής θεραπείας (9% έναντι 14%) Η εντατική θεραπεία μειώνει την εμφάνιση καρδιαγγειακών επιπλοκών στο σακχαρώδη διαβήτη τύπου 1: Αποτελέσματα μελέτης DCCT Μέση διάρκεια διαβήτη (χρόνια) Ο πρώιμος γλυκαιμικός έλεγχος μπορεί να επιβραδύνει την εξέλιξη των καρδιαγγειακών επιπλοκών Συμβατική θεραπεία Εντατική θεραπεία 1.357911131517192123252729 18 15 13 10 8 0 5 3 Αθροιστική συχνότητα καρδιοαγγειακών παθήσεων (%) Αθροιστική συχνότητα εμφάνισης καρδιαγγειακής νόσου μετά από 30 χρόνια Μέση διάρκεια διαβήτη (χρόνια) Συμβατική θεραπεία: μη ύπαρξη συγκεκριμένου γλυκαιμικού στόχου, 1 - 2 καθημερινές ενέσεις ινσουλίνης Εντατική θεραπεία: για την επίτευξη φυσιολογικών γλυκαιμικών επιπέδων, >3 καθημερινές εγχύσεις ινσουλίνης μέσω αντλίας | 10 Ερευνητική ομάδα DCCT/EDIC Arch Intern Med 2009, 169:1307-16
 Η εντατική θεραπεία μειώνει την εμφάνιση καρδιαγγειακών επιπλοκών στο σακχαρώδη διαβήτη τύπου 1: Αποτελέσματα μελέτης DCCT Μέση διάρκεια διαβήτη (χρόνια) Ο πρώιμος γλυκαιμικός έλεγχος μπορεί να επιβραδύνει την εξέλιξη των καρδιαγγειακών επιπλοκών Συμβατική θεραπεία Εντατική θεραπεία Αθροιστική συχνότητα καρδιοαγγειακών παθήσεων (%) Αθροιστική συχνότητα εμφάνισης καρδιαγγειακής νόσου μετά από 30 χρόνια Μέση διάρκεια διαβήτη (χρόνια) Συμβατική θεραπεία: μη ύπαρξη συγκεκριμένου γλυκαιμικού στόχου, καθημερινές ενέσεις ινσουλίνης Εντατική θεραπεία: για την επίτευξη φυσιολογικών γλυκαιμικών επιπέδων, >3 καθημερινές εγχύσεις ινσουλίνης μέσω αντλίας | 10 Ερευνητική ομάδα DCCT/EDIC Arch Intern Med 2009, 169:")
11
| 11 ↓43% Κίνδυνος Ακρωτηριασμού ↓37% Κίνδυνος Μικροαγγειακών Επιπλοκών ↓21% Κίνδυνος Θανάτου Σχετιζόμενου με το Διαβήτη ↓14% Κίνδυνος Εμφράγματος Μυοκαρδίου ↓14% Θνητότητα Ανεξαρτήτως Αιτιολογίας ΣΑΚΧΑΡΩΔΗΣ ΔΙΑΒΗΤΗΣ Μια πολύπλοκη, χρόνια και προοδευτική κατάσταση με σοβαρές επιπτώσεις στην υγεία και το προσδόκιμο επιβίωσης Μείωση της τάξης του 1% στα επίπεδα της HbA1c περιορίζει τον κίνδυνο Επιπλοκών του Διαβήτη (Μελέτη UKPDS) 1. Stratton IM, et al. Association of glycaemia with macrovascular and microvascular complications of type 2 diabetes (UKPDS 35): prospective observational study. BMJ 2000; 321: 405–412. 2. Piercy J, et al. Delays in insulin initiation, Abstract 2032 ADA11D1, 71 st Scientific Sessions, ADA 2011. Ο Διαβήτης σχετίζεται με την εμφάνιση σειράς απειλητικών για τη ζωή παθολογικών καταστάσεων (Μικροαγγειακές & Μακροαγγειακές Επιλοκές) 2 Αγγειακό Εγκεφαλικό Επεισόδιο Στεφανιαία Νόσος Περιφερική Αγγειακή Νόσος Διαβητική Αμφιβληστροειδ ο-πάθεια Διαβητική Νεφροπάθεια Διαβητική Νευροπάθεια (P<0.001) Γλυκαιμικοί Στόχοι (HbA 1c <7%)
: prospective observational study. BMJ 2000; 321: 405– Piercy J, et al. Delays in insulin initiation, Abstract 2032 ADA11D1, 71 st Scientific Sessions, ADA Ο Διαβήτης σχετίζεται με την εμφάνιση σειράς απειλητικών για τη ζωή παθολογικών καταστάσεων (Μικροαγγειακές & Μακροαγγειακές Επιλοκές) 2 Αγγειακό Εγκεφαλικό Επεισόδιο Στεφανιαία Νόσος Περιφερική Αγγειακή Νόσος Διαβητική Αμφιβληστροειδ ο-πάθεια Διαβητική Νεφροπάθεια Διαβητική Νευροπάθεια (P<0.001) Γλυκαιμικοί Στόχοι (HbA 1c <7%).")
12
| 12 Συνέπειες της εντατικής θεραπείας του Διαβήτη: Περίληψη των κυριότερων κλινικών μελετών Μελέτη Μικροαγγειακές Επιπλοκές Μακροαγγειακές Επιπλοκές Θνητότητα UKPDS DCCT / EDIC* ACCORD ADVANCE VADT Παρακολούθηση (Long Term Follow-up) Αρχική Μελέτη * Σε ΣΔ-1 (T1DM) Kendall DM, Bergenstal RM. © International Diabetes Center 2009 UK Prospective Diabetes Study (UKPDS) Group. Lancet 1998;352:854. Holman RR et al. N Engl J Med. 2008;359:1577. DCCT Research Group. N Engl J Med 1993;329;977. Nathan DM et al. N Engl J Med. 2005;353:2643. Gerstein HC et al. N Engl J Med. 2008;358:2545. Patel A et al. N Engl J Med 2008;358:2560. Duckworth W et al. N Engl J Med 2009;360:129. (erratum: Moritz T. N Engl J Med 2009;361:1024)
 Group. Lancet 1998;352:854. Holman RR et al. N Engl J Med. 2008;359:1577. DCCT Research Group. N Engl J Med 1993;329;977. Nathan DM et al. N Engl J Med. 2005;353:2643. Gerstein HC et al. N Engl J Med. 2008;358:2545. Patel A et al. N Engl J Med 2008;358:2560. Duckworth W et al. N Engl J Med 2009;360:129. (erratum: Moritz T. N Engl J Med 2009;361:1024).")
13
Copyright © 2015 AACE. May not be reprinted in any form without express written permission from AACE. T2D Incidence in the DPP 13 Intensive lifestyle intervention* (n=1079) T2DM incidence per 100 person-years Placebo (n=1082) Metformin 850 mg BID (n=1073) 58% 31% *Goal: 7% reduction in baseline body weight through low-calorie, low-fat diet and ≥150 min/week moderate intensity exercise. DPP, Diabetes Prevention Program; IGT, impaired glucose tolerance; T2D, type 2 diabetes. DPP Research Group. N Engl J Med. 2002;346:393-403. Q2. How is prediabetes managed?
 T2DM incidence per 100 person-years Placebo (n=1082) Metformin 850 mg BID (n=1073) 58% 31% *Goal: 7% reduction in baseline body weight through low-calorie, low-fat diet and ≥150 min/week moderate intensity exercise. DPP, Diabetes Prevention Program; IGT, impaired glucose tolerance; T2D, type 2 diabetes. DPP Research Group. N Engl J Med. 2002;346: Q2. How is prediabetes managed .")
14
Copyright © 2015 AACE. May not be reprinted in any form without express written permission from AACE. Medical and Surgical Interventions Shown to Delay or Prevent T2D 14 T2D, type 2 diabetes. 1. DPP Research Group. N Engl J Med. 2002;346:393-403. 2. STOP-NIDDM Trial Research Group. Lancet. 2002;359:2072-2077. 3. Defronzo RA, et al. N Engl J Med. 2011;364:1104-15. 4. DREAM Trial Investigators. Lancet. 2006;368:1096-1105. 5. Torgerson JS, et al. Diabetes Care. 2004;27:155-161. 6. Garvey WT, et al. Diabetes Care. 2014;37:912-921. 7. Sjostrom L, et al. N Engl J Med. 2004;351:2683-2693. Q2. How is prediabetes managed? InterventionFollow-up Period Reduction in Risk of T2D (P value vs placebo) Antihyperglycemic agents Metformin 1 2.8 years31% (P<0.001) Acarbose 2 3.3 years25% (P=0.0015) Pioglitazone 3 2.4 years72% (P<0.001) Rosiglitazone 4 3.0 years60% (P<0.0001) Weight loss interventions Orlistat 5 4 years37% (P=0.0032) Phentermine/topiramate 6 2 years79% (P<0.05) Bariatric surgery 7 10 years75% (P<0.001) Lifestyle modification should be used with all pharmacologic or surgical interventions.
 Antihyperglycemic agents Metformin years31% (P<0.001) Acarbose years25% (P=0.0015) Pioglitazone years72% (P<0.001) Rosiglitazone years60% (P<0.0001) Weight loss interventions Orlistat 5 4 years37% (P=0.0032) Phentermine/topiramate 6 2 years79% (P<0.05) Bariatric surgery 7 10 years75% (P<0.001) Lifestyle modification should be used with all pharmacologic or surgical interventions..")
15
Current management often fails to achieve glycemic targets 1. Xingbao C. Chinese Health Economics 2003. Ling T. China Diabetic Journal 2003. 2. Harris SB, et al. Diabetes Res Clin Pract 2005; 70:90–97. 3. Lopez Stewart G, et al. Rev Panam Salud Publica 2007; 22:12–20. 4. Saydah SH, et al. JAMA 2004; 291:335–342. 5. Liebl A, et al. Diabetologia 2002; 45:S23–S28. US (NHANES) 4 HbA 1c < 7% 37% 63% Europe (CODE-2) 5 HbA 1c < 6.5% 31% 69% Canada (DICE) 2 HbA 1c 7% 51% 49% China (CODIC-2) 1 HbA 1c < 7.5% 68% 32% Latin America (DEAL) 3 HbA 1c <7% 43% 57%
 4 HbA 1c < 7% 37% 63% Europe (CODE-2) 5 HbA 1c < 6.5% 31% 69% Canada (DICE) 2 HbA 1c 7% 51% 49% China (CODIC-2) 1 HbA 1c < 7.5% 68% 32% Latin America (DEAL) 3 HbA 1c <7% 43% 57%.")
16
| 16 Στην πορεία της νόσου η θνητότητα αυξάνεται Adapted from Brun E, et al. Diabetes Care 2000;23:1119-1123. 5.818 ασθενείς με ΣΔ-2 10 έτη παρακολούθησης Πληθυσμός αναφοράς Διάρκεια διαβήτη (έτη) RR θανάτου
 RR θανάτου.")
17
| 17 350 300 250 200 150 100 50 Γλυκόζη (mg/dL) –15–10–5051015202530 Έναρξη ΣΔ-2 Χρόνος (έτη) Relative effect, function or level* ΠΡΟΔΙΑΒΗΤΗΣΔΙΑΓΝΩΣΗ ΣΔ-2 250 200 150 100 50 0 Μεταγευματική Γλυκόζη Αντίσταση στην Ινσουλίνη Γλυκόζη Νηστείας Λειτουργικότητα των β-κυττάρων Φαινόμενο «Ινκρετίνης» Επίπεδα Ινσουλίνης 125 mg/dL Φυσιολογικές τιμές 200 mg/dL Κατά τη διάγνωση ΣΔ, υφίστανται ήδη τόσο μικροαγγειακές όσο και μακροαγγειακές επιπλοκές Adapted from Ramlo-Halsted B, et al. Clinical Diabetes 2000; 18(2):80-85. Adapted from Roman G, et al. Horm Metab Res 2009;41:116-122.
: Adapted from Roman G, et al. Horm Metab Res 2009;41:")
18
| 18 IEq= Islet Equivalents; PW= Pancreatic Weight Adapted from Deng S, et al. Diabetes 2004; 53:624–632. 7,000 6,000 5,000 4,000 3,000 2,000 1,000 0 0 12 3 45678 9 * * * * * * * * * * * * * * R 2 = 0.4079 Διάρκεια διαβήτη (έτη) IEq/gram of PW Η μάζα του β-κυττάρου μειώνεται προοδευτικά στον ΣΔ2
 IEq/gram of PW Η μάζα του β-κυττάρου μειώνεται προοδευτικά στον ΣΔ2.")
19
| 19 Η λειτουργία των β-κυττάρων συνεχίζει να μειώνεται, ανεξάρτητα από την παρέμβαση στον T2DM T2DM = σακχαρώδης διαβήτης τύπου 2 *Λειτουργία των β-κυττάρων όπως μετράται μέσω αξιολόγησης μοντέλου ομοιόστασης (HOMA) Προσαρμογή από UKPDS Group. Diabetes. 1995;44:1249–1258. 0 20 40 60 80 100 –5–4–3–2–10123456 Έτη από τη διάγνωση Λειτουργία των β-κυττάρων (%)* Η λειτουργία των β-κυττάρων μειώνεται προοδευτικά πριν ακόμη τεθεί διάγνωση Μετφορμίνη (n = 159) Δίαιτα (n = 110) Σουλφονυλουρία (n = 511)
* Η λειτουργία των β-κυττάρων μειώνεται προοδευτικά πριν ακόμη τεθεί διάγνωση Μετφορμίνη (n = 159) Δίαιτα (n = 110) Σουλφονυλουρία (n = 511).")
20
7 6 9 8 HbA 1c (%) 10 OAD* monotherapy Diet and exercise OAD combination OAD + basal insulin OAD monotherapy up-titration Duration of diabetes OAD + multiple daily insulin injections Conservative management of glycemia: traditional stepwise approach HbA 1c = 6.5% Campbell IW. Br J Cardiol 2000; 7:625–631. HbA 1c = 7% *OAD = oral antidiabetic

21
Up-titrating monotherapy to the maximum recommended dose may not provide benefit Gastrointestinal side effects Patients stopping treatment (%) 0 2 4 6 8 10 5001000150020002500 Metformin dosage (mg) HbA 1c -2.5 -2 -1.5 -0.5 5001000150020002500 Change in HbA 1c from placebo (%) 0 Metformin dosage (mg) Garber AJ, et al. Am J Med 1997; 103:491–497.

22
7 6 9 8 HbA 1c (%) 10 OAD* monotherapy Diet and exercise OAD combination OAD + basal insulin OAD monotherapy up-titration Duration of diabetes OAD + multiple daily insulin injections Conservative management of glycemia: traditional stepwise approach HbA 1c = 6.5% Campbell IW. Br J Cardiol 2000; 7:625–631. HbA 1c = 7% *OAD = oral antidiabetic

23
peripheral glucose uptake hepatic glucose production pancreatic insulin secretion pancreatic glucagon secretion gut carbohydrate delivery & absorption incretin effect HYPERGLYCEMIA ? Adapted from: Inzucchi SE, Sherwin RS in: Cecil Medicine 2011 Multiple, Complex Pathophysiological Abnormalities in T2DM _ _ + renal glucose excretion

24
peripheral glucose uptake hepatic glucose production pancreatic insulin secretion pancreatic glucagon secretion gut carbohydrate delivery & absorption incretin effect HYPERGLYCEMIA ? Adapted from: Inzucchi SE, Sherwin RS in: Cecil Medicine 2011 Multiple, Complex Pathophysiological Abnormalities in T2DM _ _ + renal glucose excretion DA agonists T Z D s Metformin S U s Glinides DPP-4inhibitors GLP-1Ragonists A G I s Amylinmimetics Insulin Bile acid sequestrants

25
3. ANTI-HYPERGLYCEMIC THERAPY Glycemic targets HbA1c < 7.0% (mean PG 150-160 mg/dl [8.3-8.9 mmol/l ]) - Pre-prandial PG <130 mg/dl (7.2 mmol/l ) - Post-prandial PG <180 mg/dl (10.0 mmol/l ) - Individualization is key: Tighter targets (6.0 - 6.5%) - younger, healthier Looser targets (7.5 - 8.0% + ) - older, comorbidities, hypoglycemia prone, etc. - Avoidance of hypoglycemia PG = plasma glucose ADA-EASD Position Statement Update: Management of Hyperglycemia in T2DM, 2015 Diabetes Care 2012;35:1364–1379; Diabetologia 2012;55:1577–1596 Diabetes Care 2015;38:140-149; Diabetologia 2015;58:429-442
 - Pre-prandial PG <130 mg/dl (7.2 mmol/l ) - Post-prandial PG <180 mg/dl (10.0 mmol/l ) - Individualization is key: Tighter targets ( %) - younger, healthier Looser targets ( % + ) - older, comorbidities, hypoglycemia prone, etc. - Avoidance of hypoglycemia PG = plasma glucose ADA-EASD Position Statement Update: Management of Hyperglycemia in T2DM, 2015 Diabetes Care 2012;35:1364–1379; Diabetologia 2012;55:1577–1596 Diabetes Care 2015;38: ; Diabetologia 2015;58:")
26
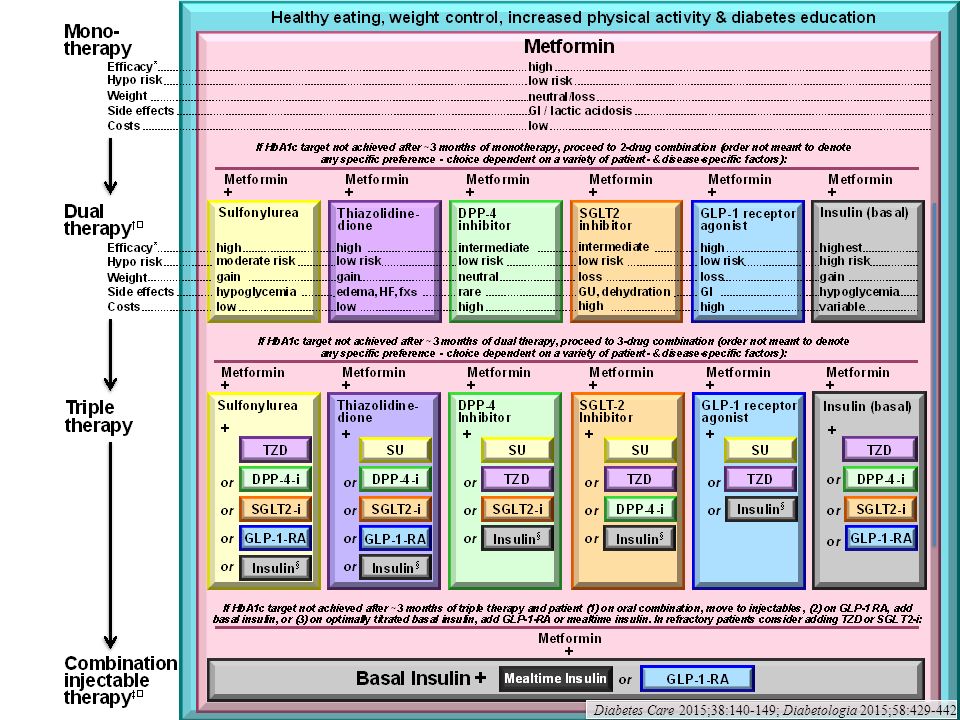
Figure 1. Modulation of the intensiveness of glucose lowering therapy in T2DM

27
Diabetes Care 2015;38:140-149; Diabetologia 2015;58:429-442

28
Figure 1. Modulation of the intensiveness of glucose lowering therapy in T2DM Diabetes Care 2015;38:140-149; Diabetologia 2015;58:429-442

29
Figure 1. Modulation of the intensiveness of glucose lowering therapy in T2DM Diabetes Care 2015;38:140-149; Diabetologia 2015;58:429-442

30
Figure 1. Modulation of the intensiveness of glucose lowering therapy in T2DM Diabetes Care 2015;38:140-149; Diabetologia 2015;58:429-442

31
Figure 1. Modulation of the intensiveness of glucose lowering therapy in T2DM Diabetes Care 2015;38:140-149; Diabetologia 2015;58:429-442

32
Figure 1. Modulation of the intensiveness of glucose lowering therapy in T2DM Diabetes Care 2015;38:140-149; Diabetologia 2015;58:429-442

33
Figure 1. Modulation of the intensiveness of glucose lowering therapy in T2DM Diabetes Care 2015;38:140-149; Diabetologia 2015;58:429-442

34
3. ANTI-HYPERGLYCEMIC THERAPY Therapeutic options: Lifestyle - Weight optimization - Healthy diet - Increased activity level ADA-EASD Position Statement Update: Management of Hyperglycemia in T2DM, 2015 Diabetes Care 2012;35:1364–1379; Diabetologia 2012;55:1577–1596

35
3. ANTI-HYPERGLYCEMIC THERAPY Therapeutic options: Oral agents & non - insulin injectables - Metformin - Sulfonylureas - Thiazolidinediones - DPP-4 inhibitors - SGLT-2 inhibitors - GLP-1 receptor agonists - Meglitinides - - glucosidase inhibitors - Colesevelam - Dopamine-2 agonists - Amylin mimetics ADA-EASD Position Statement Update: Management of Hyperglycemia in T2DM, 2015 Diabetes Care 2012;35:1364–1379; Diabetologia 2012;55:1577–1596 Diabetes Care 2015;38:140-149; Diabetologia 2015;58:429-442

36
Oral Class MechanismAdvantagesDisadvantagesCost Biguanides Activates AMP- kinase (?other) Hepatic glucose production Extensive experience No hypoglycemia Weight neutral ? CVD Gastrointestinal Lactic acidosis (rare) B-12 deficiency Contraindications Low Sulfonylure as Closes K ATP channels Insulin secretion Extensive experience Microvascular risk Hypoglycemia Weight Low durability ? Blunts ischemic preconditioning Low Meglitinide s Closes K ATP channels Insulin secretion Postprandial glucose Dosing flexibility Hypoglycemia Weight ? Blunts ischemic preconditioning Dosing frequency Mod. TZDs PPAR- activator Insulin sensitivity No hypoglycemia Durability TGs (pio) HDL-C ? CVD events (pio) Weight Edema/heart failure Bone fractures LDL-C (rosi) ? MI (rosi) Low Table 1. Properties of anti-hyperglycemic agents Diabetes Care 2015;38:140-149; Diabetologia 2015;10.1077/s00125-014-3460-0 Diabetes Care 2015;38:140-149; Diabetologia 2015;58:429-442
 B-12 deficiency Contraindications Low Sulfonylure as Closes K ATP channels Insulin secretion Extensive experience Microvascular risk Hypoglycemia Weight Low durability . Blunts ischemic preconditioning Low Meglitinide s Closes K ATP channels Insulin secretion Postprandial glucose Dosing flexibility Hypoglycemia Weight . Blunts ischemic preconditioning Dosing frequency Mod. TZDs PPAR- activator Insulin sensitivity No hypoglycemia Durability TGs (pio) HDL-C . CVD events (pio) Weight Edema/heart failure Bone fractures LDL-C (rosi) . MI (rosi) Low Table 1. Properties of anti-hyperglycemic agents Diabetes Care 2015;38: ; Diabetologia 2015; /s Diabetes Care 2015;38: ; Diabetologia 2015;58:")
37
Oral Class MechanismAdvantagesDisadvantagesCost - Glucosidase inhibitors Inhibits - glucosidase Slows carbohydrate digestion / absorption No hypoglycemia Nonsystemic Postprandial glucose ? CVD events Gastrointestinal Dosing frequency Modest A1c Mod. DPP-4 inhibitors Inhibits DPP-4 Increases incretin (GLP-1, GIP) levels No hypoglycemia Well tolerated Angioedema / urticaria ? Pancreatitis ? Heart failure High Bile acid sequestrant s Bind bile acids ? Hepatic glucose production No hypoglycemia LDL-C Gastrointestinal Modest A1c Dosing frequency High Dopamine-2 agonists Activates DA receptor Alters hypothalamic control of metabolism insulin sensitivity No hypoglyemia ? CVD events Modest A1c Dizziness, fatigue Nausea Rhinitis High SGLT2 inhibitors Inhibits SGLT2 in proximal nephron Increases glucosuria Weight No hypoglycemia BP Effective at all stages GU infections Polyuria Volume depletion LDL-C Cr (transient) High Table 1. Properties of anti-hyperglycemic agents Diabetes Care 2015;38:140-149; Diabetologia 2015;58:429-442
 levels No hypoglycemia Well tolerated Angioedema / urticaria . Pancreatitis . Heart failure High Bile acid sequestrant s Bind bile acids . Hepatic glucose production No hypoglycemia LDL-C Gastrointestinal Modest A1c Dosing frequency High Dopamine-2 agonists Activates DA receptor Alters hypothalamic control of metabolism insulin sensitivity No hypoglyemia . CVD events Modest A1c Dizziness, fatigue Nausea Rhinitis High SGLT2 inhibitors Inhibits SGLT2 in proximal nephron Increases glucosuria Weight No hypoglycemia BP Effective at all stages GU infections Polyuria Volume depletion LDL-C Cr (transient) High Table 1. Properties of anti-hyperglycemic agents Diabetes Care 2015;38: ; Diabetologia 2015;58:")
38
Injectabl e ClassMechanismAdvantagesDisadvantagesCost Amylin mimetic s Activates amylin receptor glucagon gastric emptying satiety Weight Postprandial glucose Gastrointestinal Modest A1c Injectable Hypo if insulin dose not reduced Dosing frequency Training requirements High GLP-1 receptor agonists Activates GLP-1 R Insulin, glucagon gastric emptying satiety Weight No hypoglycemia Postprandial glucose Some CV risk factors Gastrointestinal ? Pancreatitis Heart rate Medullary ca (rodents) Injectable Training requirements High Insulin Activates insulin receptor Myriad Universally effective Unlimited efficacy Microvascular risk Hypoglycemia Weight gain ? Mitogenicity Injectable Patient reluctance Training requirements Variabl e Table 1. Properties of anti-hyperglycemic agents Diabetes Care 2015;38:140-149; Diabetologia 2015;58:429-442
 Injectable Training requirements High Insulin Activates insulin receptor Myriad Universally effective Unlimited efficacy Microvascular risk Hypoglycemia Weight gain . Mitogenicity Injectable Patient reluctance Training requirements Variabl e Table 1. Properties of anti-hyperglycemic agents Diabetes Care 2015;38: ; Diabetologia 2015;58:")
39
Figure 2. Anti-hyperglycemic therapy in T2DM: General recommendations Diabetes Care 2015;38:140-149; Diabetologia 2015;58:429-442

40
Figure 2. Anti-hyperglycemic therapy in T2DM: General recommendations Diabetes Care 2015;38:140-149; Diabetologia 2015;58:429-442

41
Figure 2. Anti-hyperglycemic therapy in T2DM: General recommendations Diabetes Care 2015;38:140-149; Diabetologia 2015;58:429-442

43
HbA1c ≥9% Metformin intolerance or contraindication Uncontrolled hyperglycemia (catabolic features, BG ≥300-350 mg/dl, HbA1c ≥10-12%)
")
44
Figure 2A. Anti-hyperglycemic therapy in T2DM: Avoidance of hypoglycemia Diabetes Care 2015;38:140-149; Diabetologia 2015;58:429-442

45
Figure 2B. Anti-hyperglycemic therapy in T2DM: Avoidance of weight gain

46
Figure 2C. Anti-hyperglycemic therapy in T2DM: Minimization of costs Diabetes Care 2015;38:140-149; Diabetologia 2015;58:429-442

47
ADA-EASD Position Statement Update: Management of Hyperglycemia in T2DM, 2015 3. ANTI-HYPERGLYCEMIC THERAPY Therapeutic options: Insulins Human Insulins - Neutral protamine Hagedorn (NPH) - Regular human insulin - Pre-mixed formulations Insulin Analogues - Basal analogues (glargine, detemir, degludec) - Rapid analogues (lispro, aspart, glulisine) - Pre-mixed formulations Diabetes Care 2012;35:1364–1379; Diabetologia 2012;55:1577–1596 Diabetes Care 2015;38:140-149; Diabetologia 2015;58:429-442
 - Regular human insulin - Pre-mixed formulations Insulin Analogues - Basal analogues (glargine, detemir, degludec) - Rapid analogues (lispro, aspart, glulisine) - Pre-mixed formulations Diabetes Care 2012;35:1364–1379; Diabetologia 2012;55:1577–1596 Diabetes Care 2015;38: ; Diabetologia 2015;58:")
48
ADA-EASD Position Statement Update: Management of Hyperglycemia in T2DM, 2015 Long (Detemir) Rapid (Lispro, Aspart, Glulisine) Hours Long (Glargine) 0 2 4 6 8 10 12 14 16 18 20 22 24 Short (Regular) Hours after injection Insulin level (Degludec) 3. ANTI-HYPERGLYCEMIC THERAPY Therapeutic options: Insulins

49
Figure 3. Approach to starting & adjusting insulin in T2DM Diabetes Care 2015;38:140-149; Diabetologia 2015;58:429-442

50
Figure 3. Approach to starting & adjusting insulin in T2DM Diabetes Care 2015;38:140-149; Diabetologia 2015;58:429-442

51
Figure 3. Approach to starting & adjusting insulin in T2DM Diabetes Care 2015;38:140-149; Diabetologia 2015;58:429-442

Παρόμοιες παρουσιάσεις


. ΣΥΓΚΟΠΤΙΚΗ ΚΡΙΣΗ Αιφνίδια και σύντομη απώλεια συνείδησης που προκαλείται από ανεπαρκή εγκεφαλική αιμάτωση λόγω μειωμένης.>")


 ωφελέειν ή μη βλάπτειν ωφελέειν = θεραπευτική παρέμβαση μη βλάπτειν = ασφάλεια ασθενών.>")
